My unwavering determination and curiosity led to the discovery of a revolutionary strategy that has transformed the trading landscape. I hope that The Investment Innovator EA will serve as an inspiration to those who may be struggling in their trading endeavors, as there is always a new opportunity waiting to be discovered through persistence and an open-minded approach.
To provide traders with a better understaning of how the EA works, I have implemented a visualization of the neural network using computer vision technology. By displaying this information directly on the trading chart, users can see exactly how the algorithm is analyzing market data and making trading decisions.This approach offers a level of transparency and insight that is essential for traders to make informed decisions. Without a clear understanding of how the EA is functioning, traders may be hesitant to trust the algorithm and act on its recommendations. By leveraging computer vision to provide real-time visualizations of the neural network's analysis, traders can have greater confidence in the algorithm's performance and make more informed decisions. Th approach not only enhances the user experience but also improves the overall effectiveness of the EA 
A brief overview of the technical work of The Investment Innovator EA:
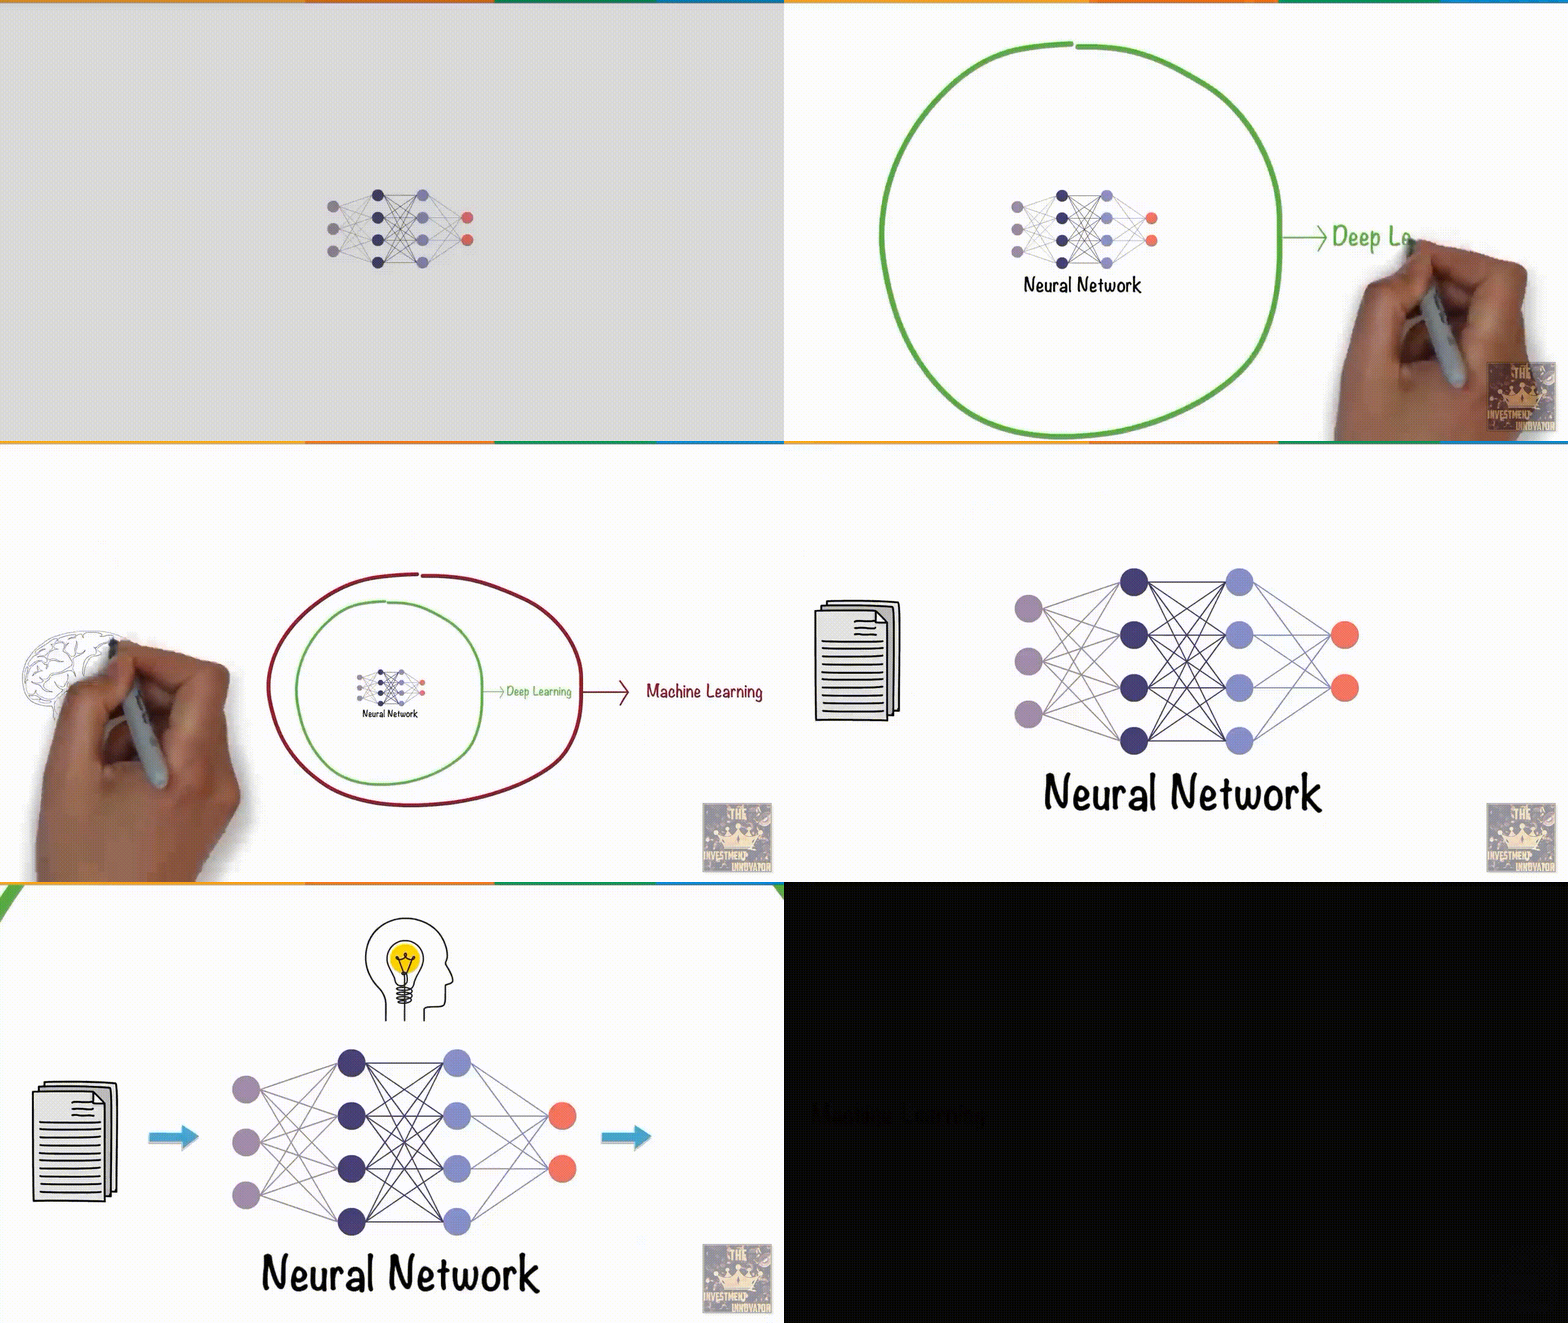
Pattern Recognition and Machine Learning in Simple Words.
One of the most common applications of machine learning is pattern recognition.
Pattern recognition is the process of recognizing regularities in data by a machine that uses machine learning algorithms. In the heart of the process lies the classification of events based on statistical information, historical data, or the machine’s memory.A pattern is a regularity in the world or in abstract notions. If we talk about books or movies, a description of a genre would be a pattern. If a person keeps watching black comedies, Netflix wouldn’t recommend them heartbreaking melodramas. The most popular programming language for pattern recognition is Python. In order for a machine to look for patterns in the data, the data must be pre-processed and converted into a form that the computer can understand. The researcher can then use classification, regression, or clustering algorithms, depending on the available information about the problem, to obtain valuable results:
- Classification. In classification, the algorithm assigns labels to data based on the predefined features. This is an example of supervised learning.
- Clustering. An algorithm splits data into a number of clusters based on the similarity of features. This is an example of unsupervised learning.
- Regression. Regression algorithms try to find a relationship between variables and predict unknown dependent variables based on known data. It is based on supervised learning.
How does pattern recognition work?
There are three types of pattern recognition models:
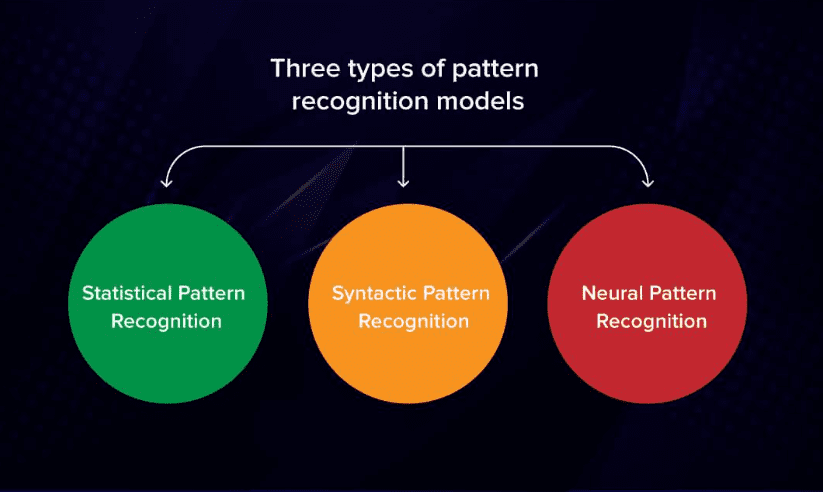
Statistical Pattern Recognition
This type of pattern recognition refers to statistical historical data when it learns from examples: it collects observations, processes them, and learns to generalize and apply these rules to new observations.
Syntactic Pattern Recognition
It is also called structural pattern recognition because it relies on simpler subpatterns called primitives. . he pattern is described in terms of connections between the primitives.
Neural Pattern Recognition
In neural pattern recognition, artificial neural networks are used. They can learn complex nonlinear input-output relations and adapt themselves to the data.
Pattern recognition process:
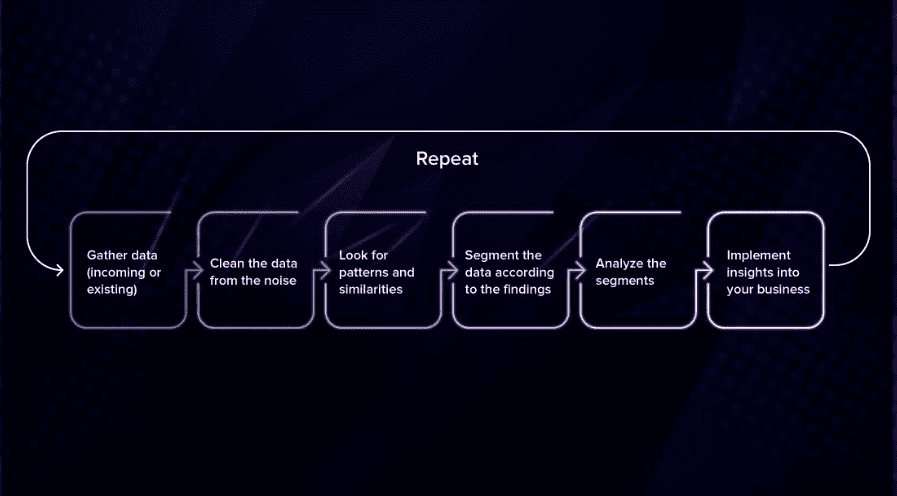
- First, you need to gather data.
- Then, you preprocess it and clean it from the noise.
- The algorithm examines the data and looks for relevant features or common elements.
- Then, these elements are classified or clustered;
- Each segment is analyzed for insights;
- Finally, the extracted insights are implemented in practice.
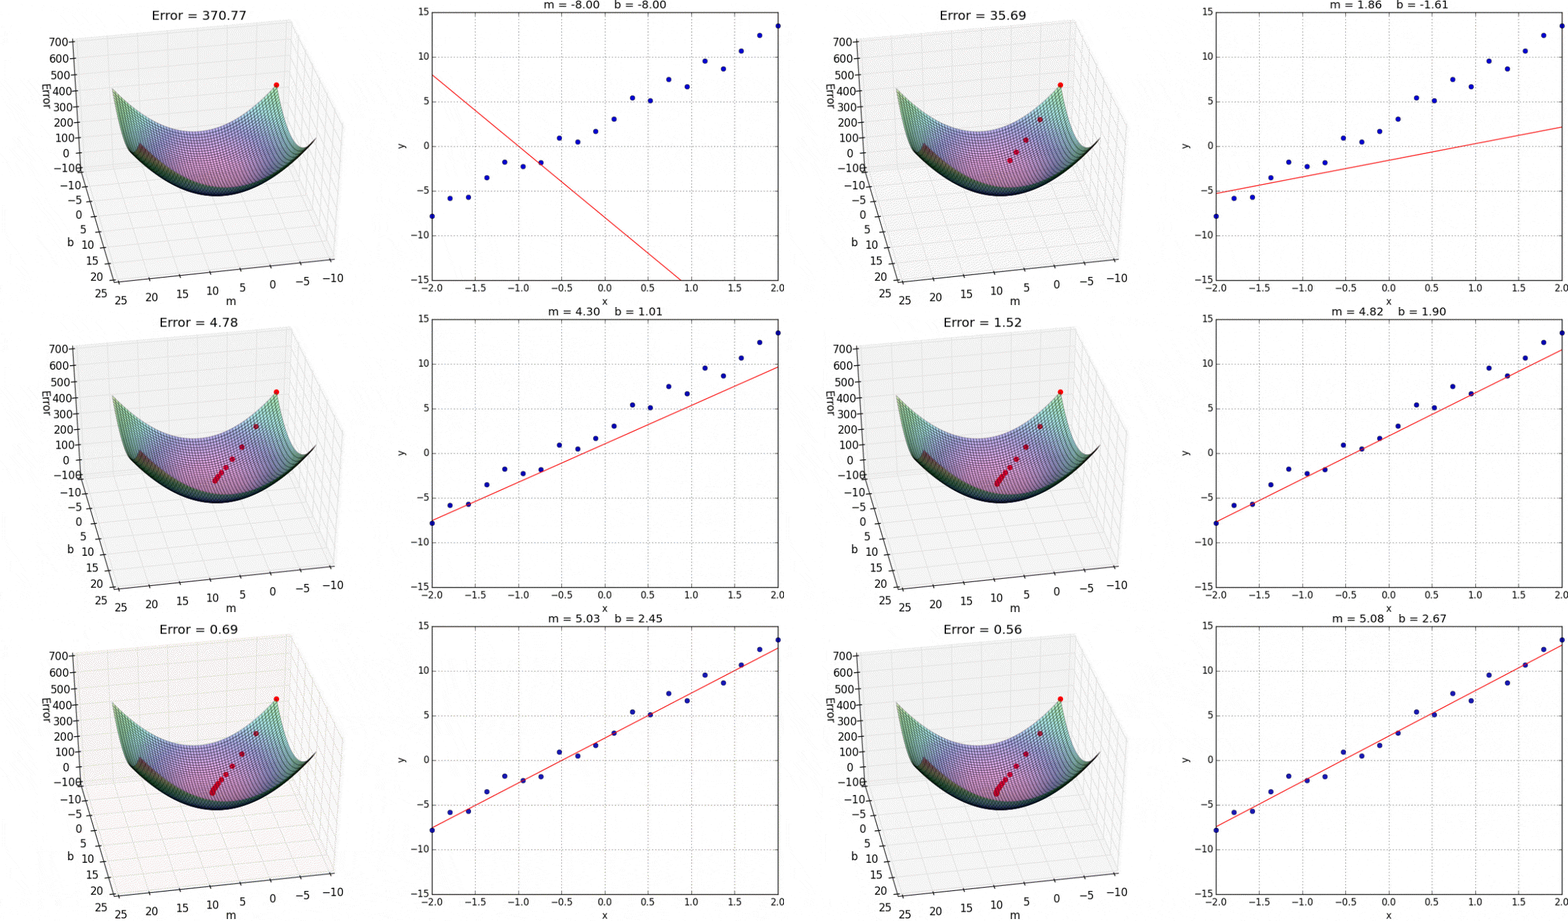
- I would also like to provide a brief overview of the data that I have implemented into the advisor after optimizing it, using visualization on the trading chart.
Through extensive analysis and optimization, I have identified specific data points that are critical for the EA's performance. By visualizing this data on the trading chart, users can see how these factors impact the EA's decision-making process and gain a deeper understanding of its performance. Incorporating this data into the advisor and visualizing it on the trading chart is just one of the ways that I have worked to enhance the user experience and improve the effectiveness of the EA.
The Investment Innovator EA MT5
The Investment Innovator EA MT4
All questions about advisor work


