Modeling the dynamics of Bitcoin cryptocurrency quotes (BTC/USD).
The models of possible future dynamics of Bitcoin cryptocurrency quotes presented in this analytical material as of November 29, 2022 have a high probability of realization (75% - 99%) and are relevant as of the date of their compilation. This means that no model of future dynamics can have a 100% probability of being realized, and that absolutely every model requires subsequent adjustments to the time and cost intervals of future price fluctuations, depending on the emerging fractal structures of low and medium orders.
The models of the future dynamics of Bitcoin cryptocurrency quotes presented below are based on high-order fractal structures, the implementation of which should be followed as long as the formation of low- and medium-order fractal structures corresponds to them. Otherwise, a revision of the global fractal structure is required and the compilation of new models, taking into account the newly formed fractal structures of medium and low orders.
The future dynamics of Bitcoin quotes is determined by the global fractal structure that is formed on the chart of the BTC/USD quotes dynamics, which is a fractal structure of the highest order, which is a global fractal attractor, the construction of which in a non-linear dynamic system occurs simultaneously with fractal structures of high, medium and low orders (in including those formed on charts with minute time frames).
Below is an analysis of the fractal structure that has developed on the charts of Bitcoin (BTC/USD) quotes dynamics, plotted as of 11/27/2022 with the following time frames: 34 years, 21 years, 13 years, 10 years, 8 years, 5 years, 3 years, 2 years, 1 year, 6 months, 4 months, 3 months, 2 months, 1 month, 1 week, 1 day.
Analysis of fractal structures of different orders allows you to determine which fractals are formed, which fractals are formed and which fractals can be formed, thereby identifying possible scenarios for the development of the chart for modeling future quotes dynamics.
The starting period for plotting is March 2011. All charts below are built as of the closing of the week 11/27/2022.
To determine the global fractal structure, let's first consider charts built with time frames: 34 years, 21 years, 13 years, 10 years.
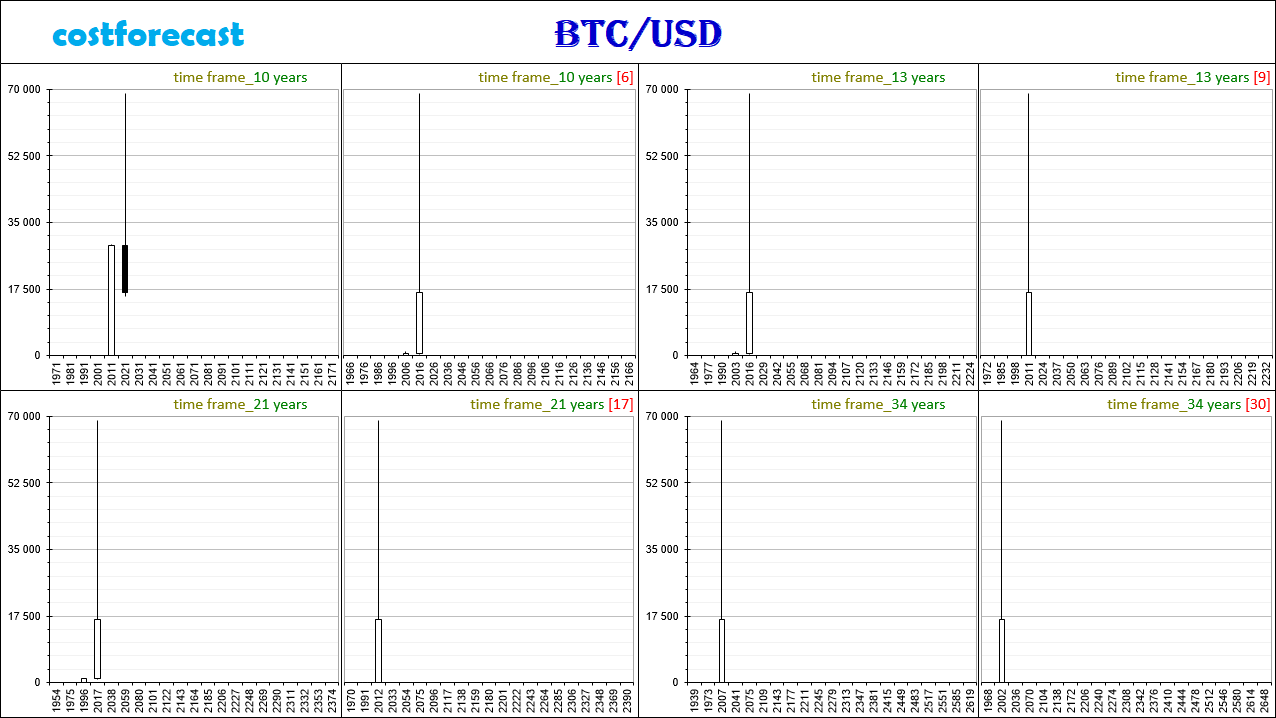
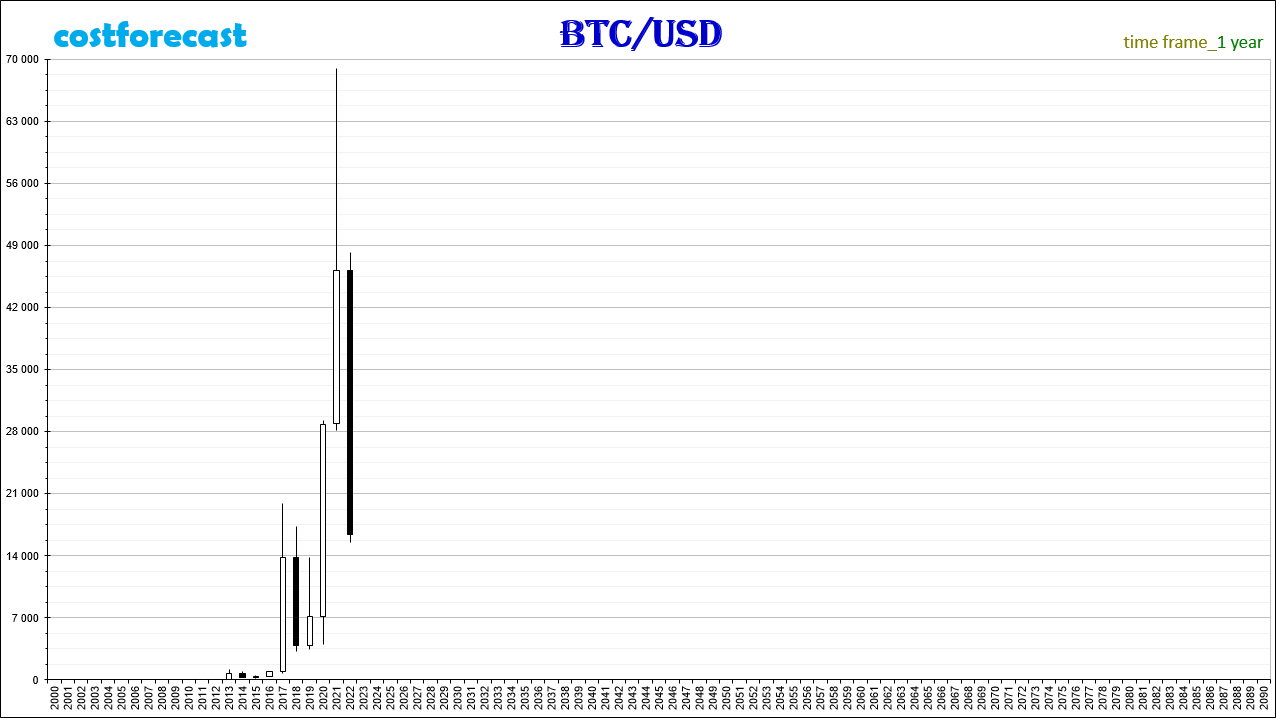
On fig. 1 the charts are based on the usual values of quotes. Taking into account the increase in the cost of Bitcoin by more than 100,000 times, to determine the segmentation of fractal structures, we will consider graphs built on logarithmic values.
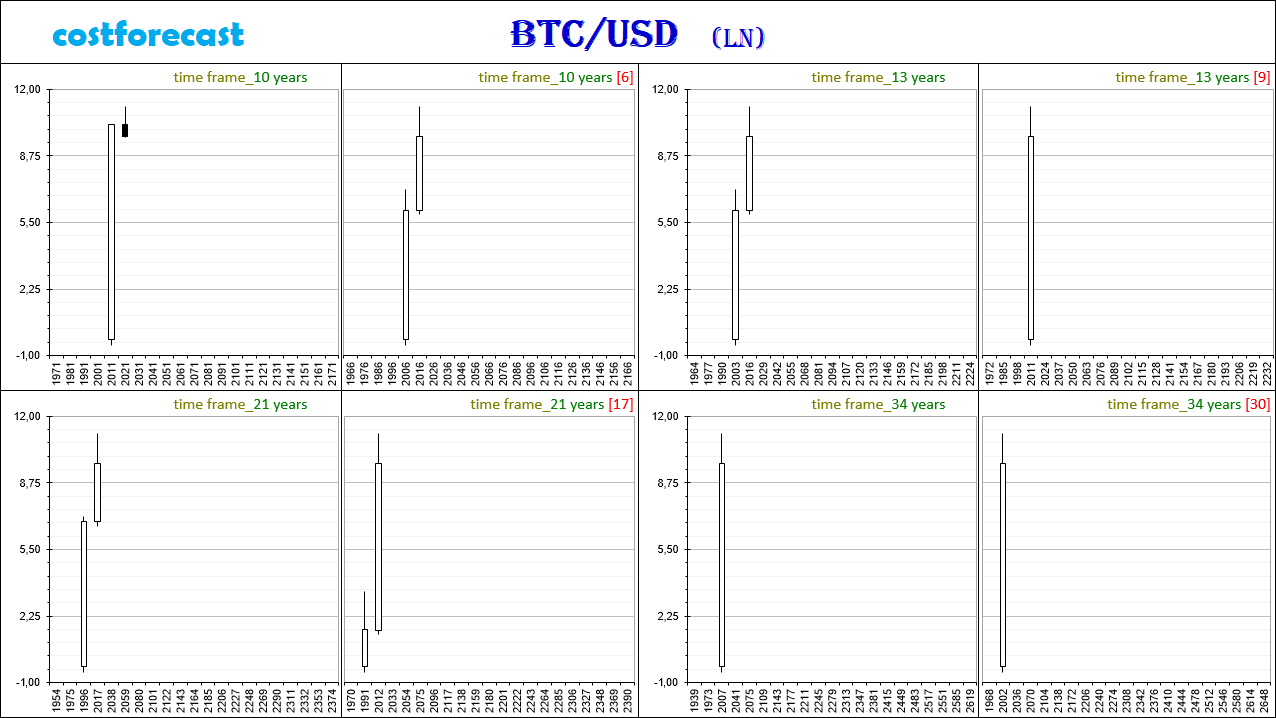
On fig. 2 shows the absence of segmentation of fractal structures on charts with time frames: 34 years, 21 years, 13 years, 10 years.
The lack of segmentation is also observed on charts with smaller time frames: 8 years (Fig. 3), 5 years (Fig. 4) and 3 years (Fig. 5).
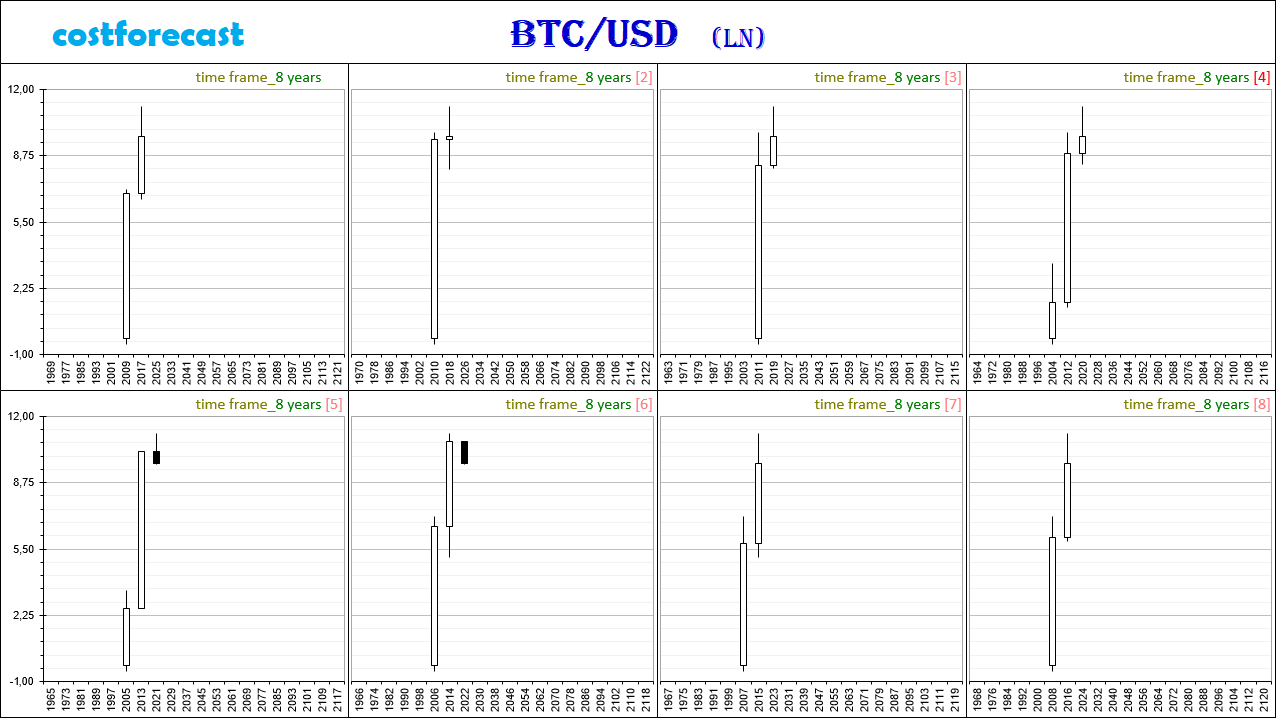
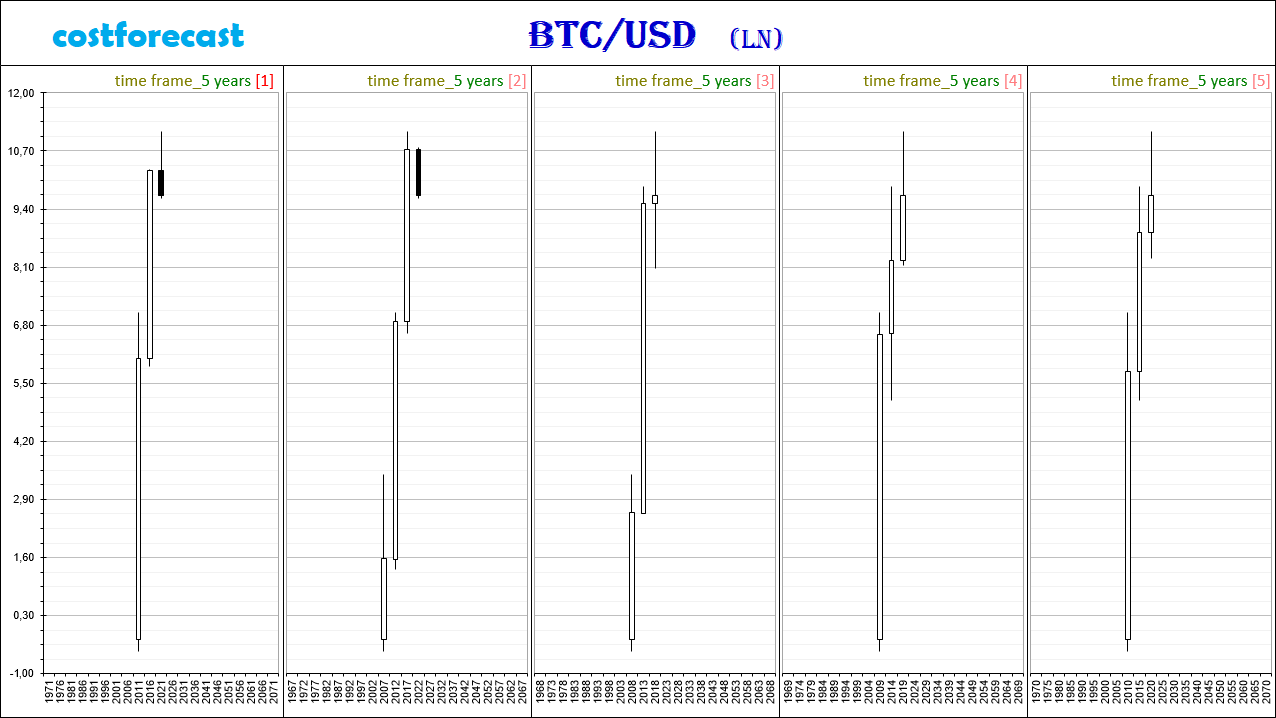
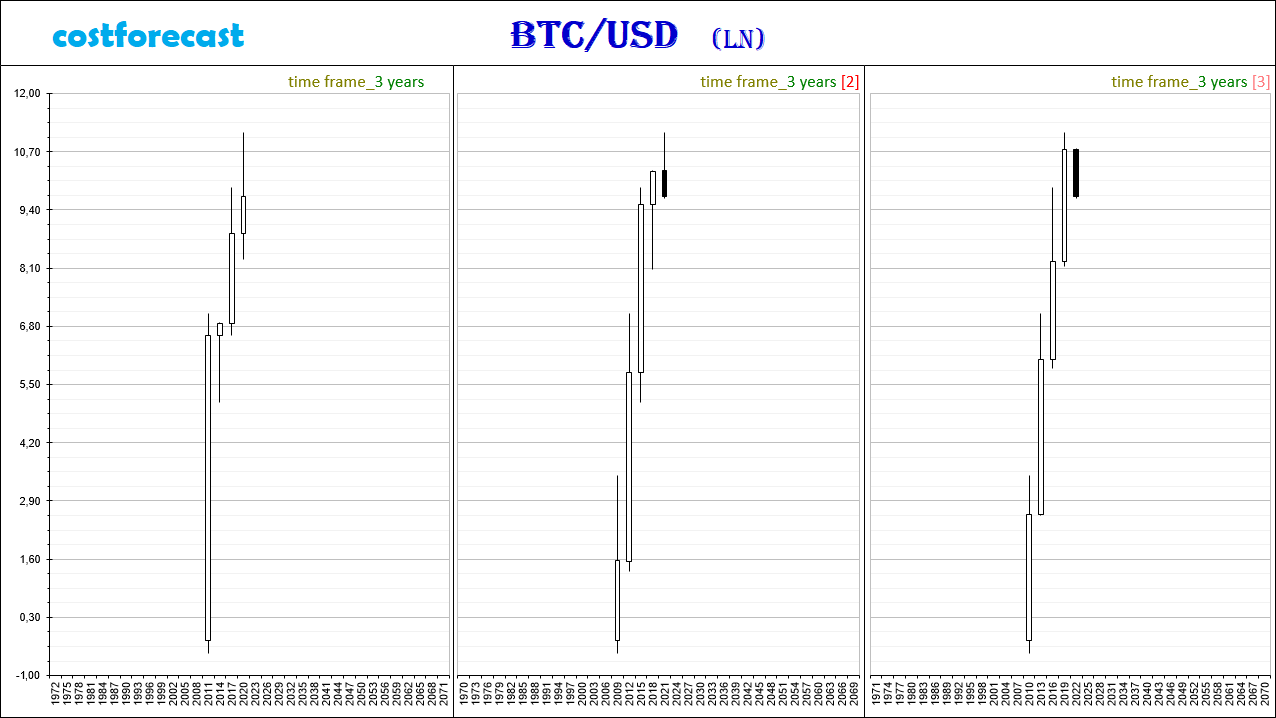
Segmentation in the fractal structure is observed on charts built with time frames of 2 years and below.
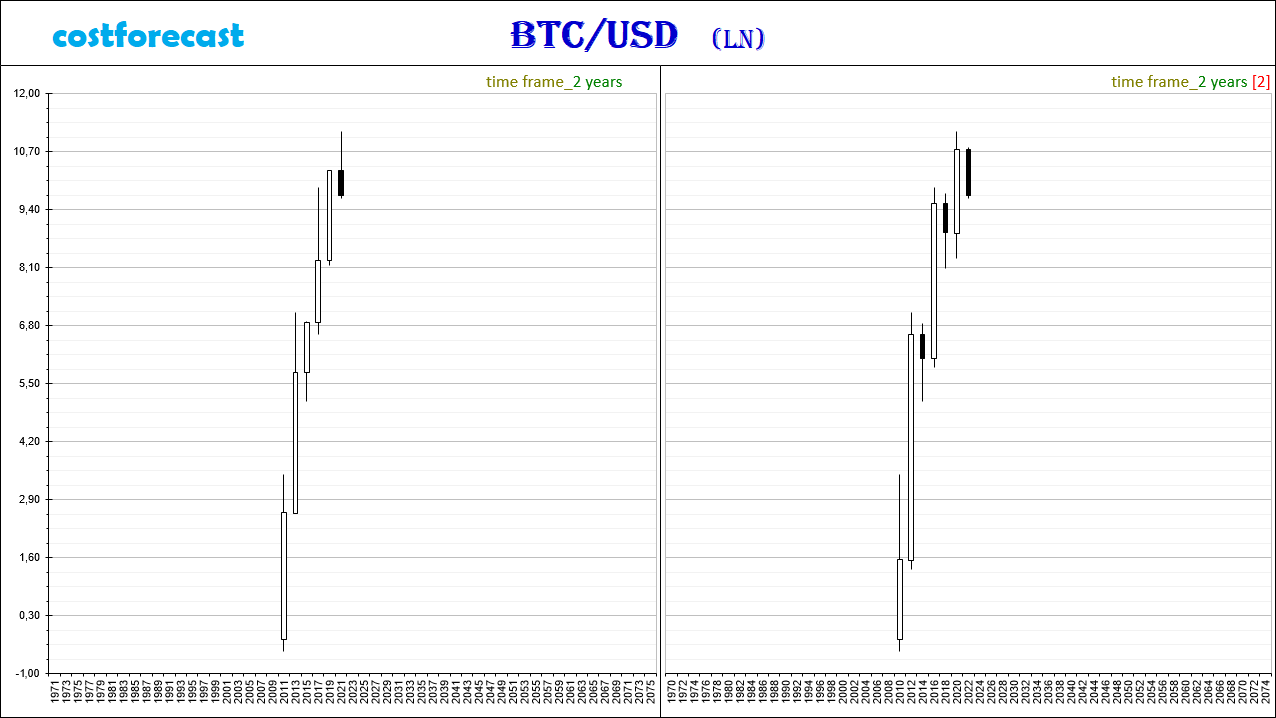
The absence of segmentation on charts with time frames of 3 years and above suggests that the first segment of the global fractal has not yet been formed within the uptrend. In this case, we denote the mono-segment formed on these charts as the 1st segment of the global fractal F.
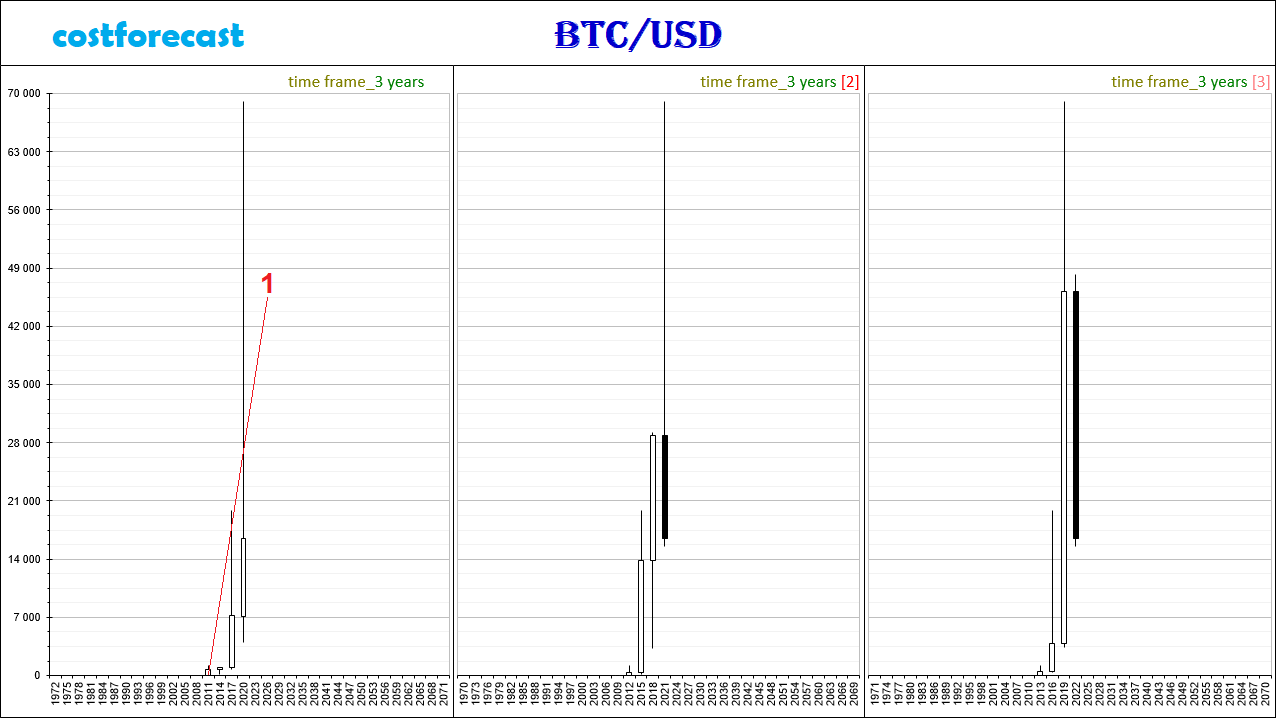
On fig. 7 The 1st segment of the global fractal F is schematically marked with a red line. This mono-segment will be a fractal of the 1st order F1.
Next, let's move on to the analysis of fractal structures on charts with time frames below 3 years to determine the type and type of the global fractal-attractor that this 1st segment of the F fractal, marked in red, will tend to.
Let's start the analysis of fractal structures on the chart with a 1-year time frame with the assumption that on the chart with a 2-year time frame (Fig. 8), the fractal marked in green is the F11 fractal.
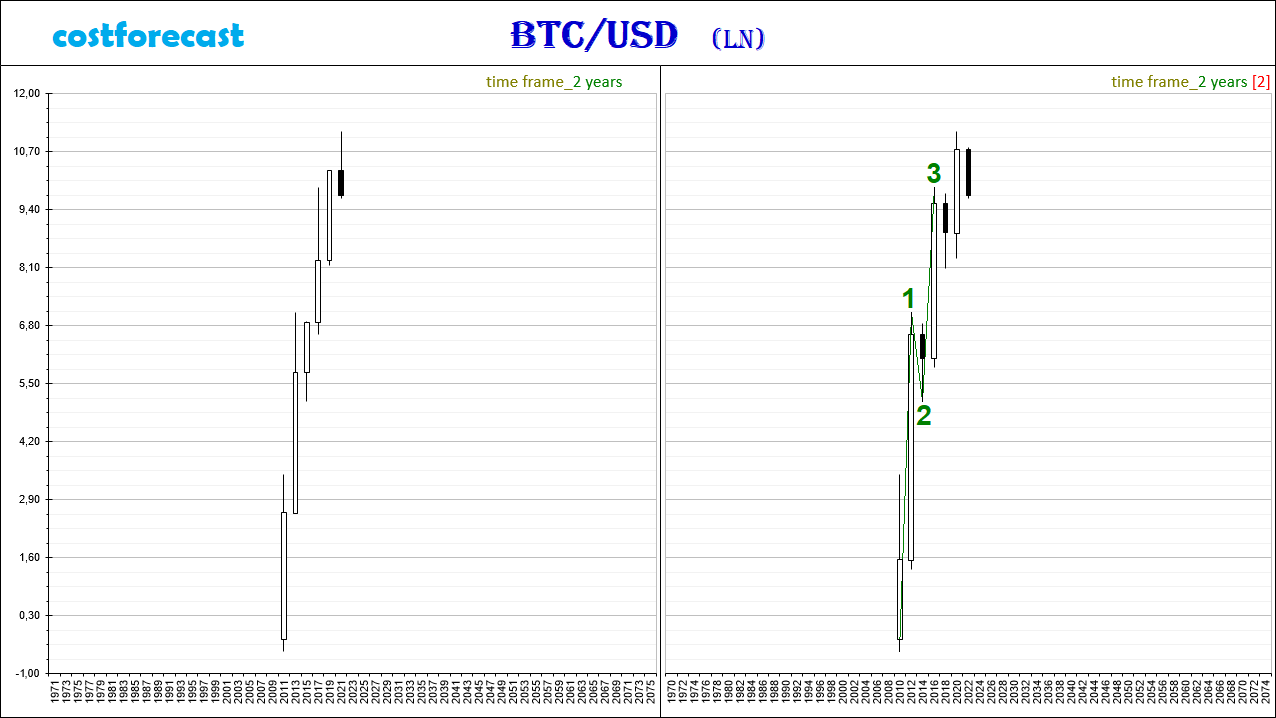
On a chart built with a time frame of 1 year using the usual values (Fig. 9), it is difficult to identify segments of fractals F111, F112, F113.
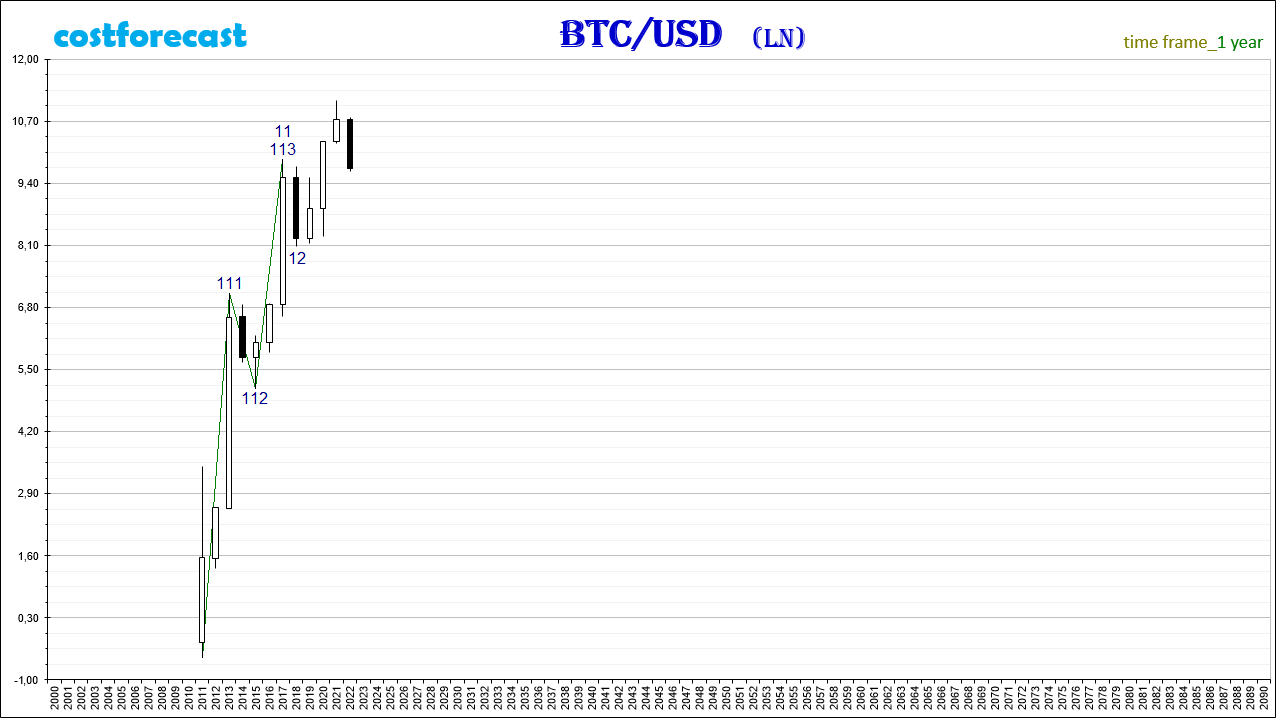
Let's denote the segments of the fractal F11, on the chart with a time frame of 1 year, built on logarithmic values.
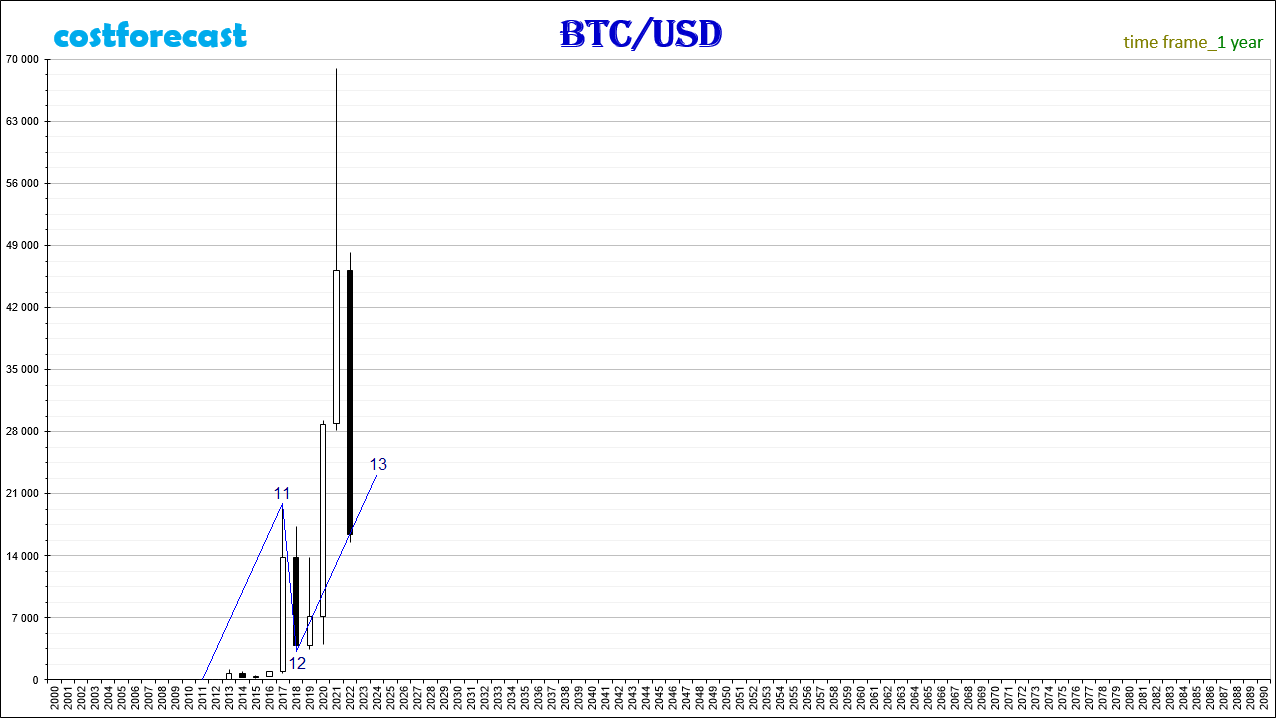
In this case, the current dynamics of Bitcoin quotes takes place within the framework of the formation of the F13 fractal (Fig. 11), which is the 3rd segment of the fractal, marked in blue.
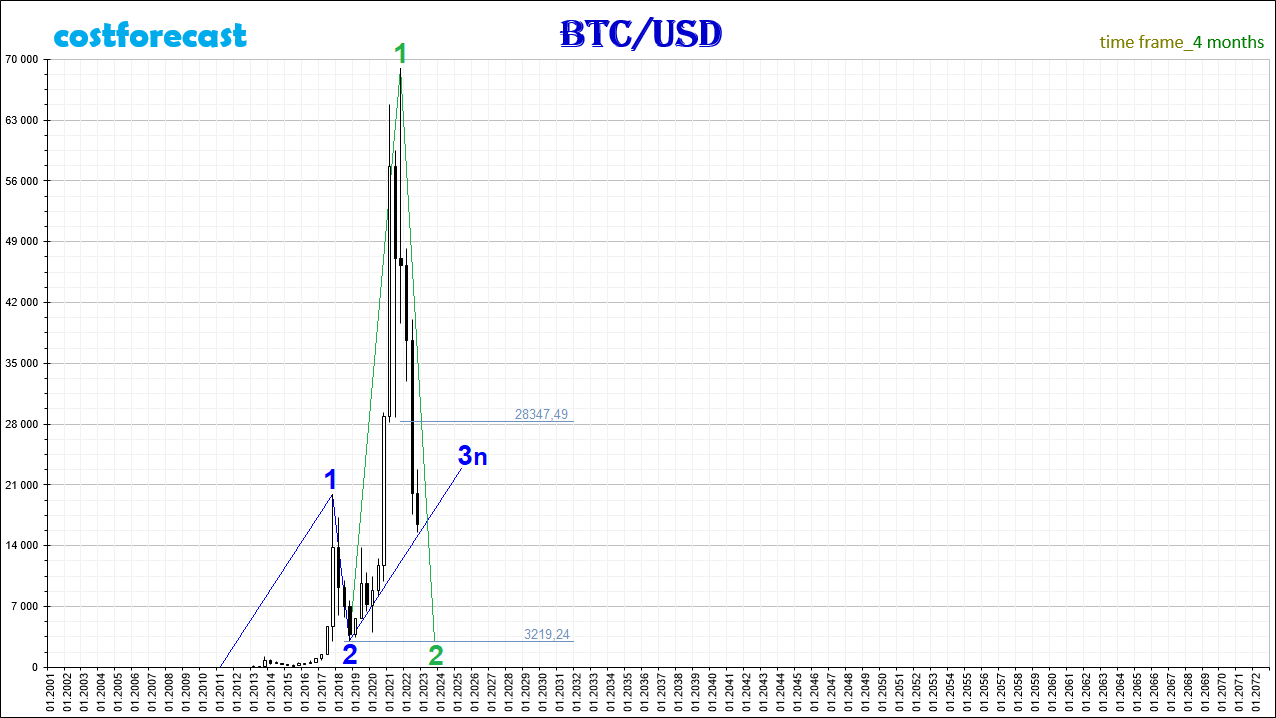
On a chart with a time frame of 6 months, the 3rd segment (F13) of the blue fractal is marked as “3n”, which means the cost and time intervals of the 1st and 3rd segments are equal.
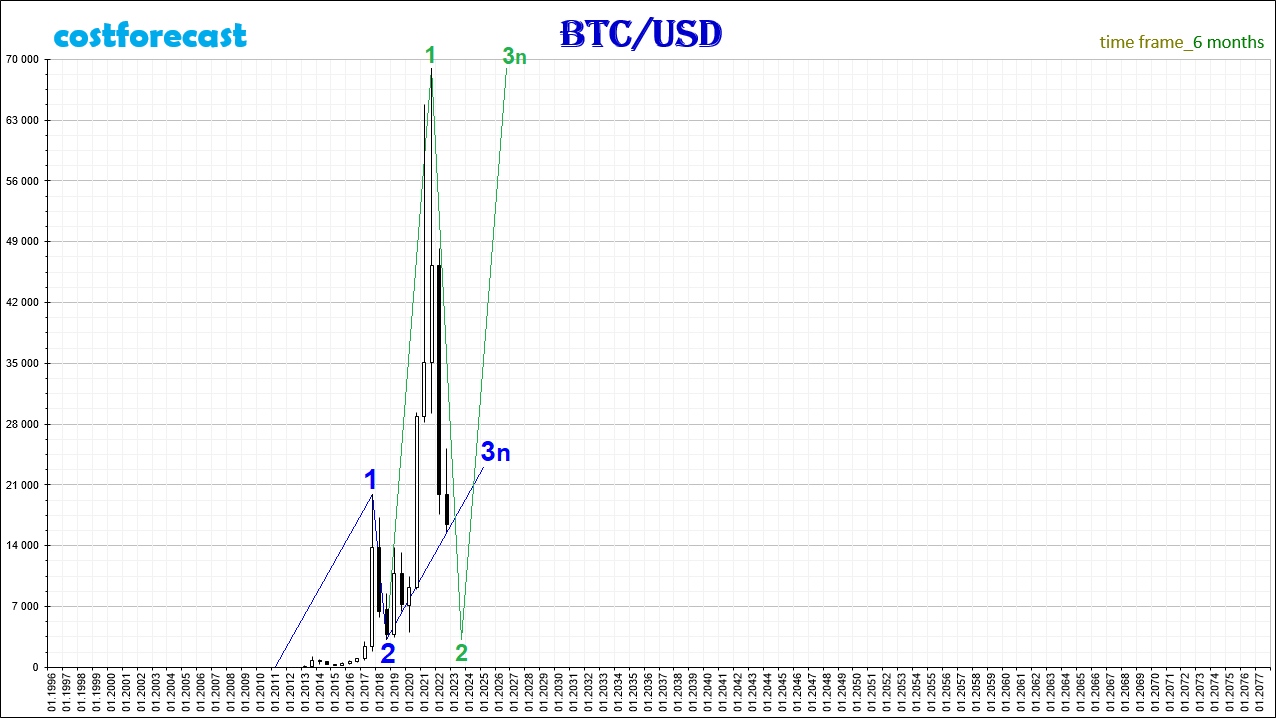
On the chart with a time frame of 6 months, the formation of a fractal, indicated in Fig. 12 in bright green color, which in relation to the blue fractal has a lower order by one and which can be its 3rd segment.
In this case, the 1st segment of the bright green fractal is completed and the dynamics that we are currently observing takes place within the framework of the formation of the 2nd segment of the bright green fractal.
This assumption says that the downtrend in the dynamics of Bitcoin quotes will continue until 2023, until the moment when the 2nd segment of the bright green fractal ends and the formation of the 3rd segment begins.
The 2nd segment of the bright green fractal, after the quotes overcome the mark of 28347.49, which is from the beginning of the decline by 61.8% from the cost interval of the 1st segment, will tend to reach the support level at 3219.24 (Fig. 13).
Analyzing the fractal structures that have formed on charts built with time frames of 3 months or less, we can assume that the most likely decline in quotes as part of the formation of the 2nd segment of a bright green fractal will be a decrease in quotes through the formation of a fractal, indicated by rice. 14 in orange, which, after its completion, will end the downtrend by completing the 2nd segment of the bright green fractal.
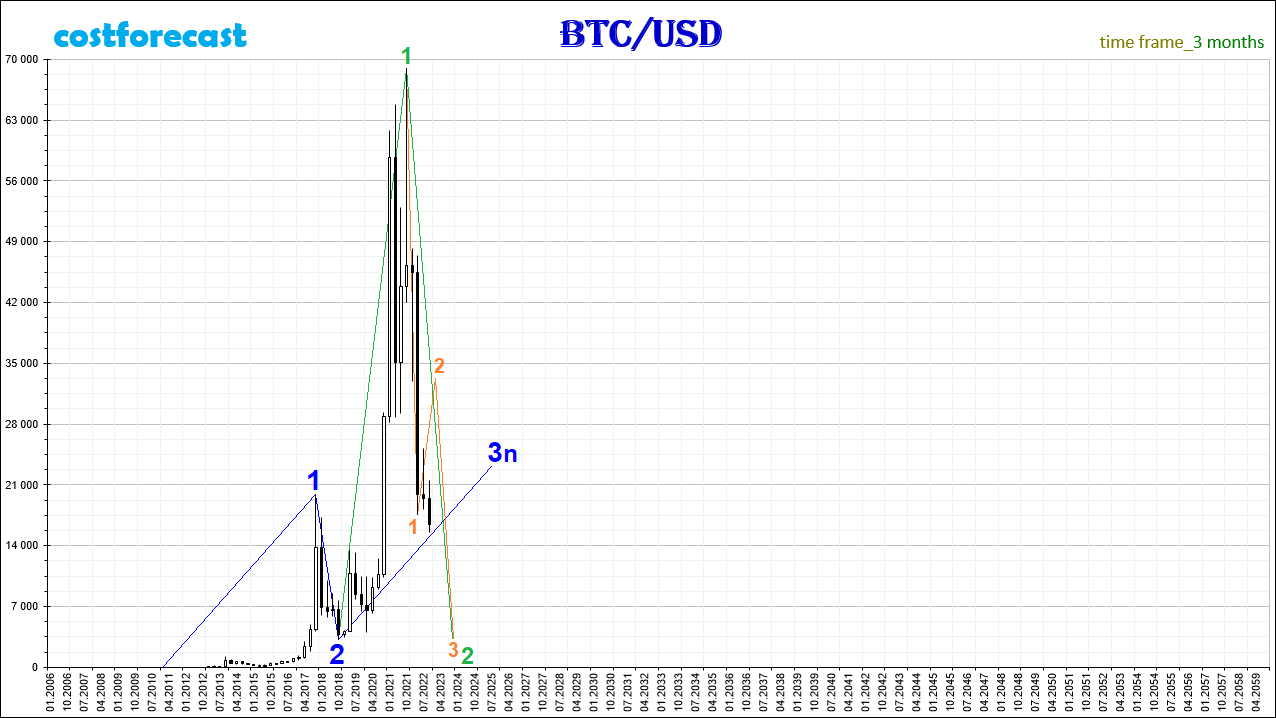
An analysis of fractal structures on charts with time frames of a month or less shows that the dynamics of quotes is in the stage of formation of the 2nd segment of the orange fractal (Fig. 15), after the completion of the 1st segment at the point with coordinates (06/18/2022; 17630,50).
The completion of the 2nd segment of the orange fractal may take place at the beginning of March 2023 at the level of 33000.00, after which the downward dynamics will continue as part of the formation of the 3rd segment of the orange fractal.
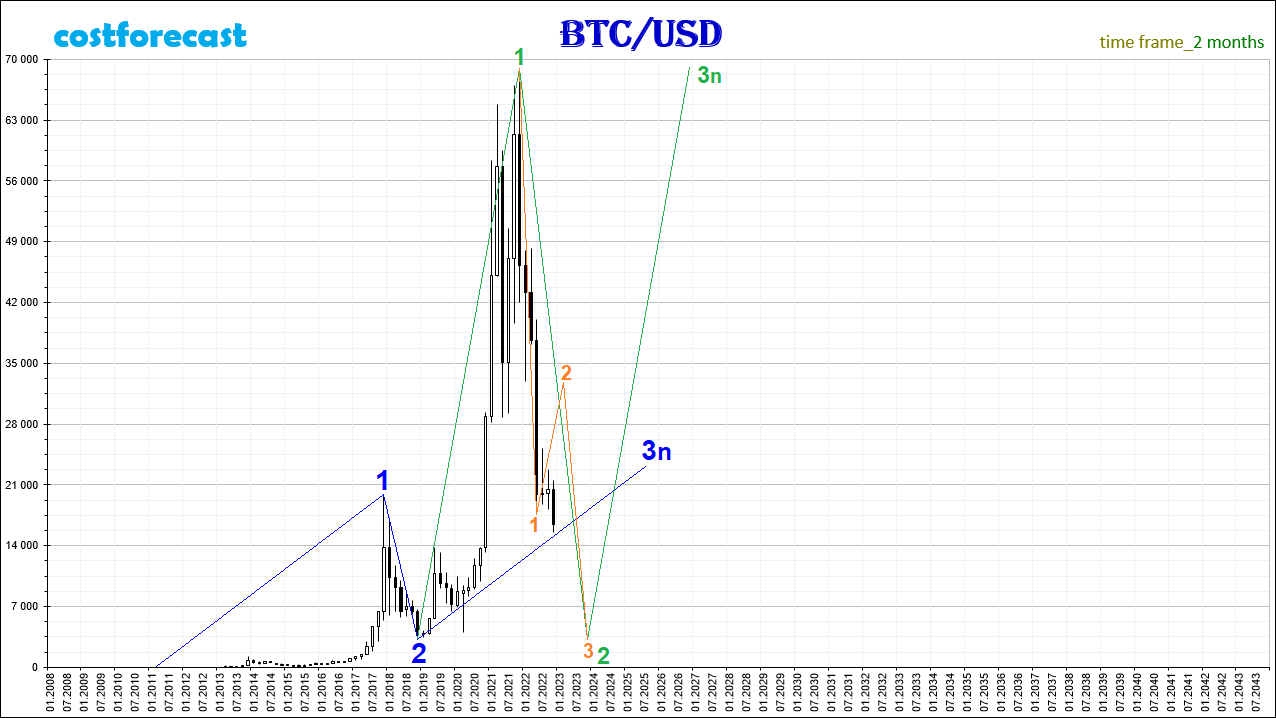
Taking into account these assumptions, the most likely model for the future dynamics of Bitcoin quotes will be a model according to which the global fractal structure will tend at the level of fractal structures of high, medium and low orders to form an attractor fractal F12 (view 1, type 2), designated on the chart with a blue fractal (Fig. 16) on the time interval (2011; 2028).
The fractal-attractor, marked in blue with segments F11, F12, F13, will be the 1st segment F1 of a fractal of a higher order, marked in red (Fig. 16).
This model for a long-term period of time assumes that within the downward dynamics of Bitcoin quotes, which began at the point with coordinates (11/10/2021; 69000.00), a 4th order fractal, indicated by F1321 segments, should form. F1322. F1323 is orange, which will represent the 2nd segment of the 3rd order fractal, indicated by bright green segments F131, F132, F133 (Fig. 16).
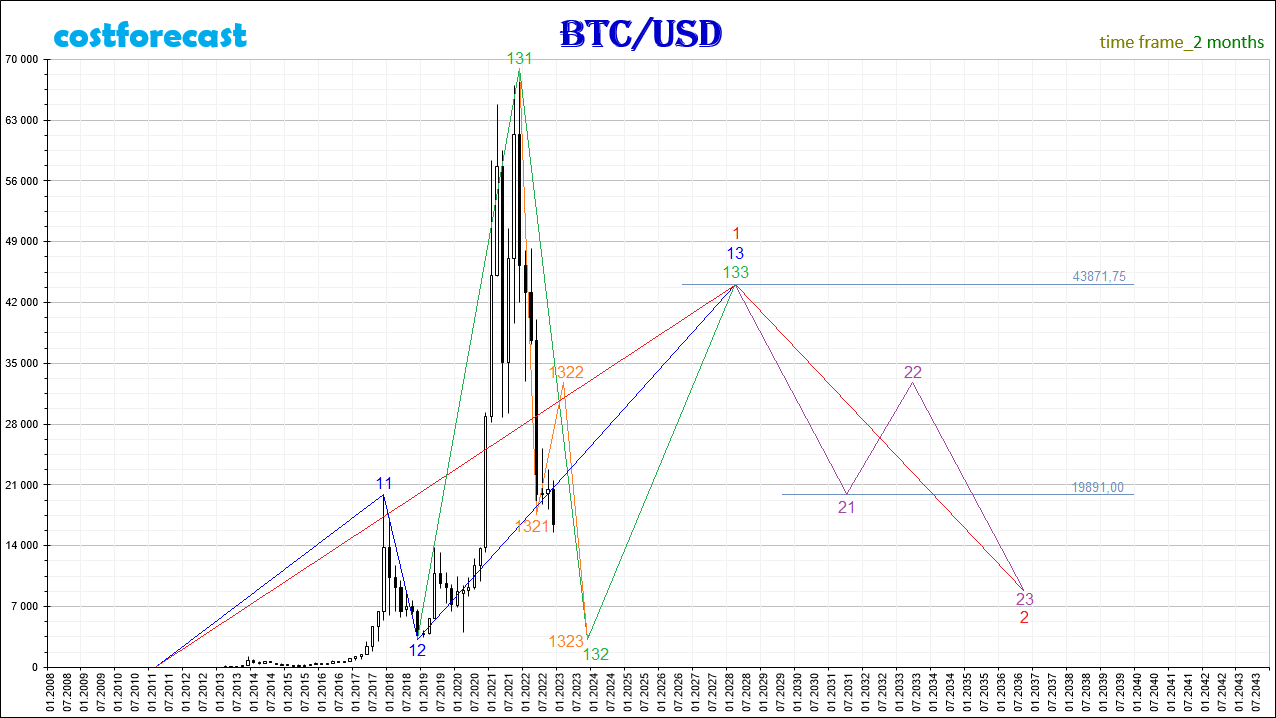
At the moment, the formation of a bright green fractal in the form of an F23 fractal (2nd view, 3rd type) with a truncated 3rd segment F133 seems to be the most likely, the completion of which falls at the beginning of 2028 around the mark 43871.75.
The completion of a bright green fractal having a 3rd order will mean the completion of a blue fractal having a 2nd order and the completion of the 1st segment of a red fractal having the highest 1st order.
In the long term, we can say that the end of the downtrend may occur on the time interval (2021; 2023), after which the uptrend will begin on the time interval (2023; 2028). Further dynamics of Bitcoin quotes after 2028 will take place in a global bearish trend as part of the formation of the 2nd segment F2 of the red fractal, which is indicated on the chart by the 2nd order fractal by segments F21, F22, F23 purple.
An analysis of fractal structures that develop on charts with time intervals of 1 month or less gives reason to believe that the 1st segment of the fractal, indicated in bright green, was formed on the time interval (12/15/2018; 11/10/2021) in the form of the F11 fractal (1st view, 1st type), marked in olive color (Fig. 17).
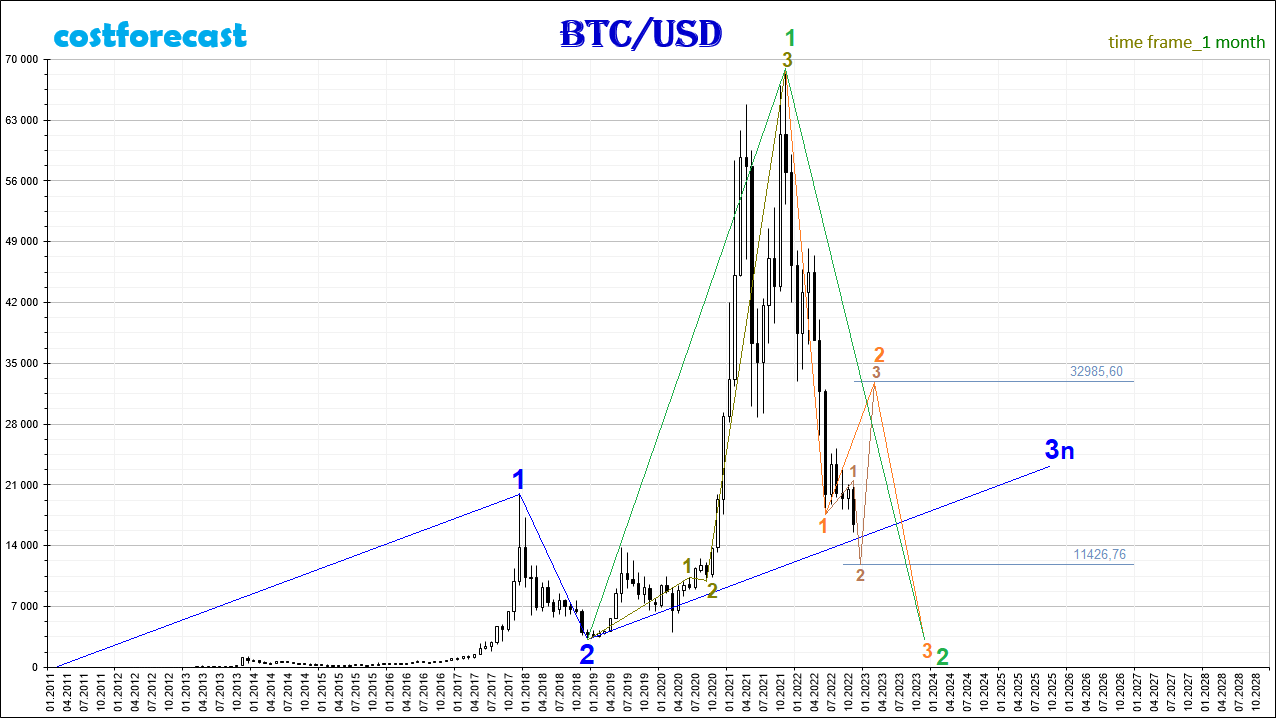
The 2nd segment of the bright green fractal currently being formed in the form of a fractal of a lower order of orange color is in the stage of formation of a fractal, indicated in brown, which, after its completion, will represent the 2nd segment of an orange fractal of a higher order.
According to the analysis of fractal structures of smaller orders, formed on the charts of the weekly and daily timeframe, we can assume that the 1st segment of the brown fractal is completed and the current dynamics is taking place within the framework of the formation of the 2nd segment of the brown fractal.
At the moment, in the medium term, it is most likely that Bitcoin quotes will continue to fall to the level of 11426.76, followed by a sharp increase in quotes to the resistance level at 32985.60, as part of the formation of the 3rd segment of the brown fractal, which will complete the 2nd segment of the orange higher order fractal. This should be followed by a decrease in quotes as part of the formation of the 3rd segment of the orange fractal towards a strong support level at around 3219.24.
An orange fractal completed in this way will stop the downtrend by forming the 2nd segment of a bright green fractal.
To predict the dynamics of Bitcoin quotes for a short period of time, an analysis of fractal structures on charts with weekly, daily and hourly time frames is required.
An analysis of the fractal structure on the chart with a weekly time frame (Fig. 18) suggests that the 1st segment of the orange fractal was formed on the time interval (11/10/2021; 06/18/2022) in the form of the F22 fractal (view 2, type 2), after which the downward dynamics turned into a side trend as part of the formation of the 2nd segment of this orange fractal.
At the moment, the most probable scenario is that the 2nd segment of the orange fractal can form in the form of an F15 fractal (view 1, type 5), which is indicated in light brown.
We can confidently assume that the 1st segment of the light brown fractal formed as a light purple fractal on the time interval (06/18/2022; 11/05/2022).
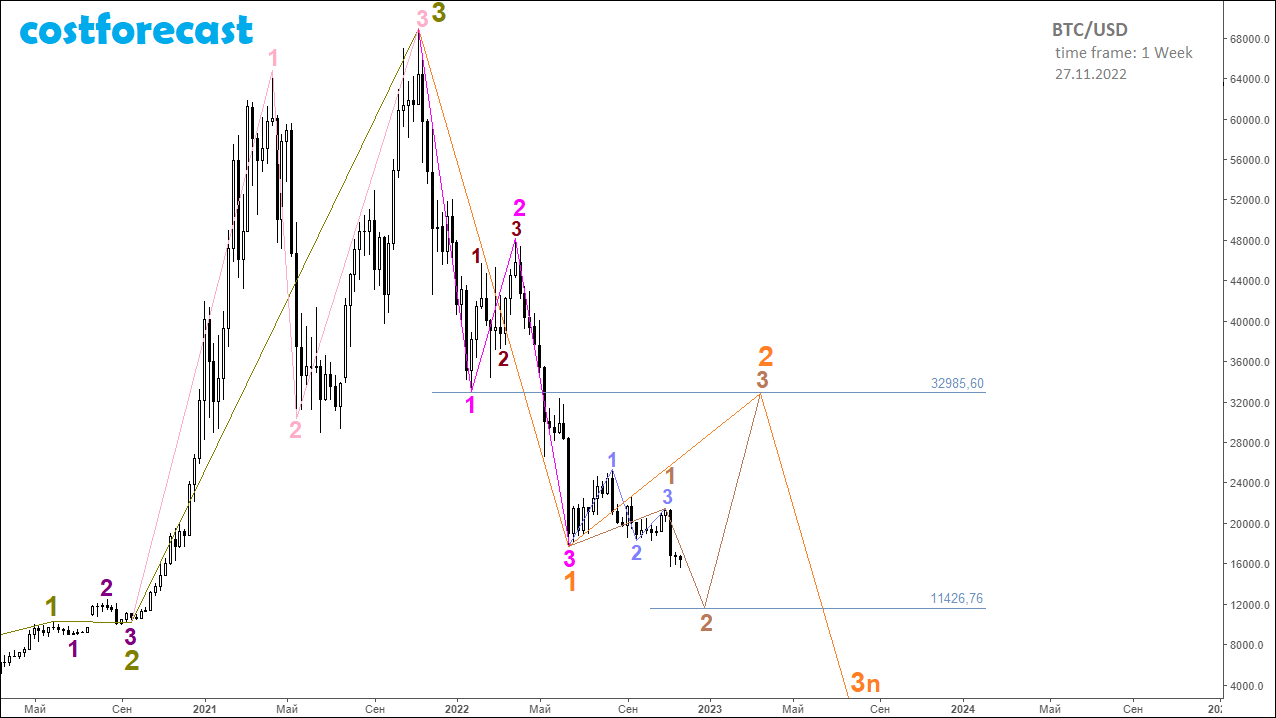
In this case, the quotes decline from the point with coordinates (11/05/2022; 21464.70) will continue, as it will take place within the formation of the 2nd segment of the light brown fractal, which may end at 11426.76. After that, quotes will rise to the resistance level at 32985.60 as part of the formation of the 3rd segment of the light brown fractal, the completion of which will mean the completion of the 2nd segment of the orange fractal, which has a higher order by one.
With the completion of the 2nd segment of the orange fractal, the flat trend will end and the quotes will begin to decline as part of the formation of the 3rd segment of the orange fractal.
An analysis of the fractal structure formed on the chart of the Bitcoin quotes dynamics, built with a daily time frame as of November 27, 2022 (Fig. 19), suggests that the future dynamics of quotes in the short term will take place in a sideways trend as part of the formation of a 2-th segment of the fractal, which is marked in blue.
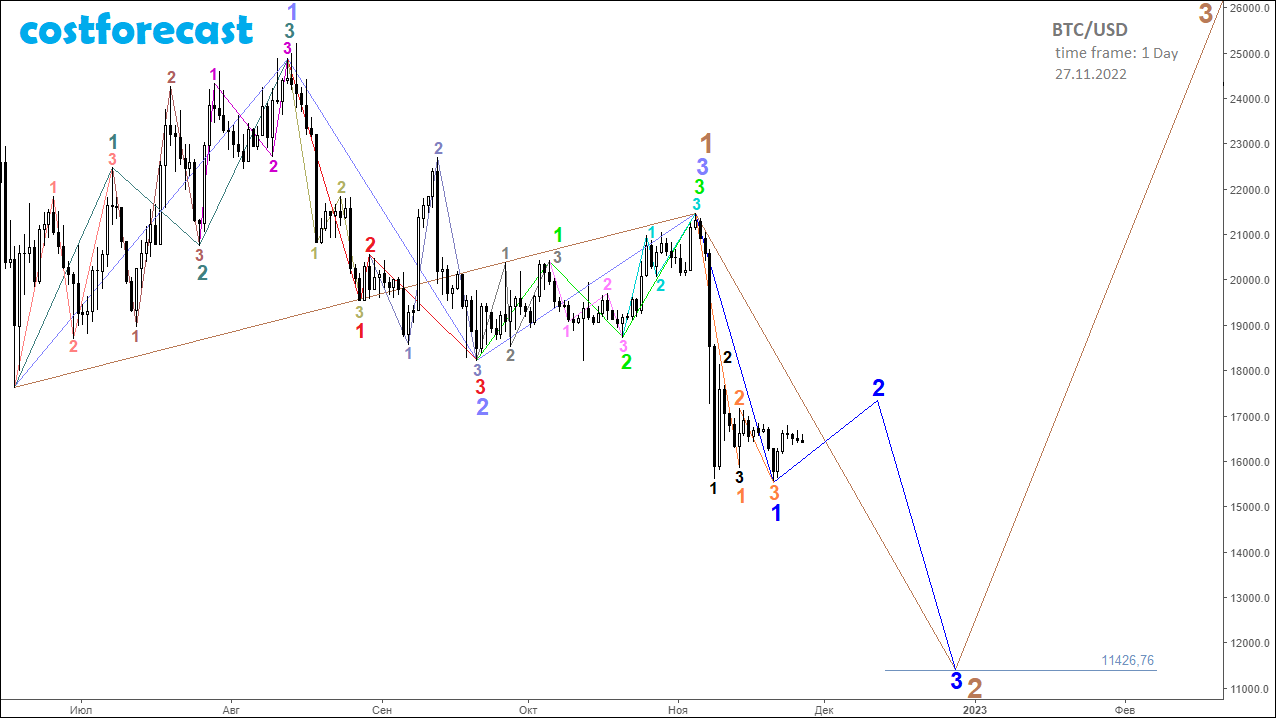
The fractal marked in blue, in case of its formation, will be the 2nd segment of the fractal with an order one higher, which is marked in light brown. The estimated completion time for the blue fractal is mid-December 2022.
The decline in quotes will be short-term due to the fact that after the completion of the 2nd segment of the light brown fractal, the 3rd segment will begin to form, as a result of which Bitcoin quotes may soar to 33,000.00 by March 2023.
The models of the future dynamics of the value of financial assets for the short, medium and long term indicated in the analytical reports may require in the future to make adjustments to the values of the time and cost intervals of the predicted fractal structures in accordance with how fractal structures of various orders (low, medium, high), under the influence of what is happening in the global financial market.
Important. The probability of realizing a model of future value dynamics can never be 100%. At any moment of time, there are always several models for the development of future dynamics. Some models have a higher probability of implementation, others less. As the dynamics develop, some models cease to be relevant for implementation, opening a window of opportunity for the implementation of other new models.
The process of modeling the dynamics of value in the financial market is continuous 24/7/365.


