

1. Illusory trends.
Gentlemen! Market theory should be built only from the standpoint of making profit on it and nothing else. For, no other his theory is of practical interest.
Let us, therefore, define the trend as (1) a unidirectional price drift, the knowledge of which can be used to make a profit, and we define the channel as (2) a geometric figure, which captures the main price fluctuations in a characteristic period of time and also allows you t o make a profit(due to price fluctuations inside this figure and on its breakdown).
Now, gentlemen, guess: “The quotes history of which currencies are shown in the following graphs?” (Fig. 1-3) and “Was it possible to make a profit on the channels and trends that appeared clearly there?”
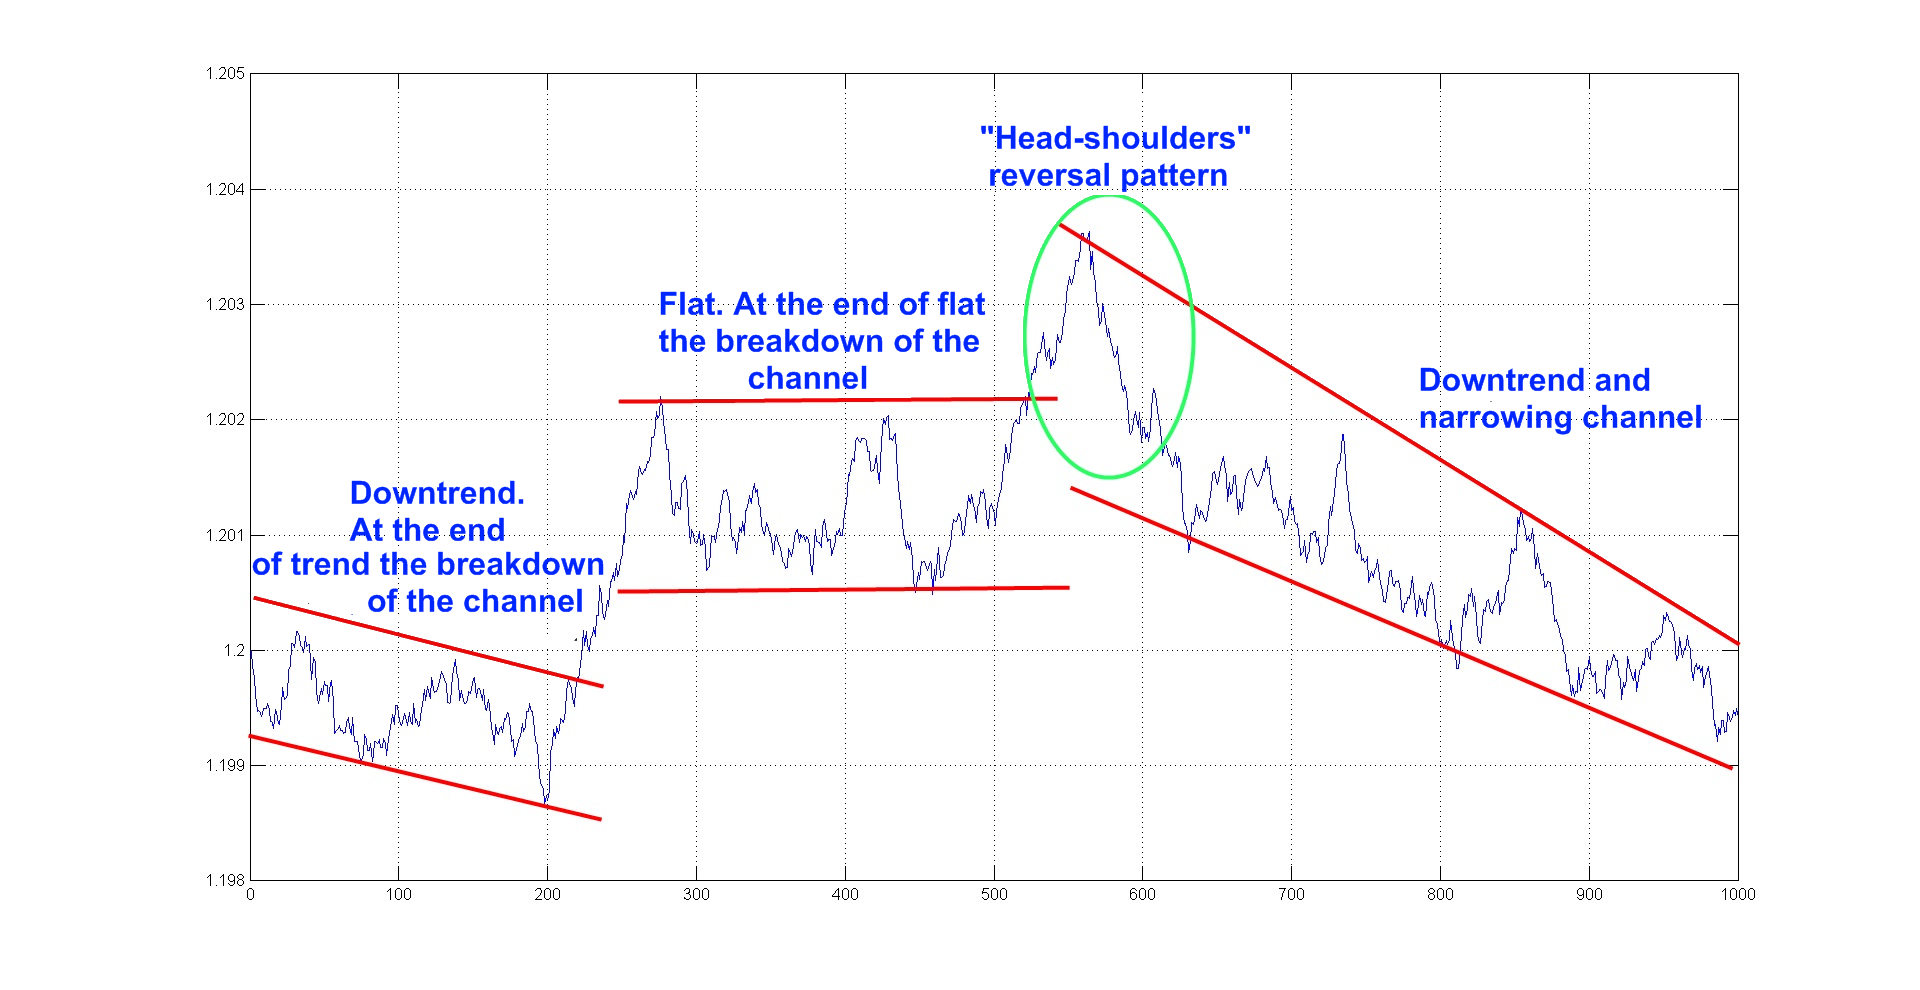
Fig.1. Here are the downtrend channels, the flat channel, their strong breakouts against the trend.
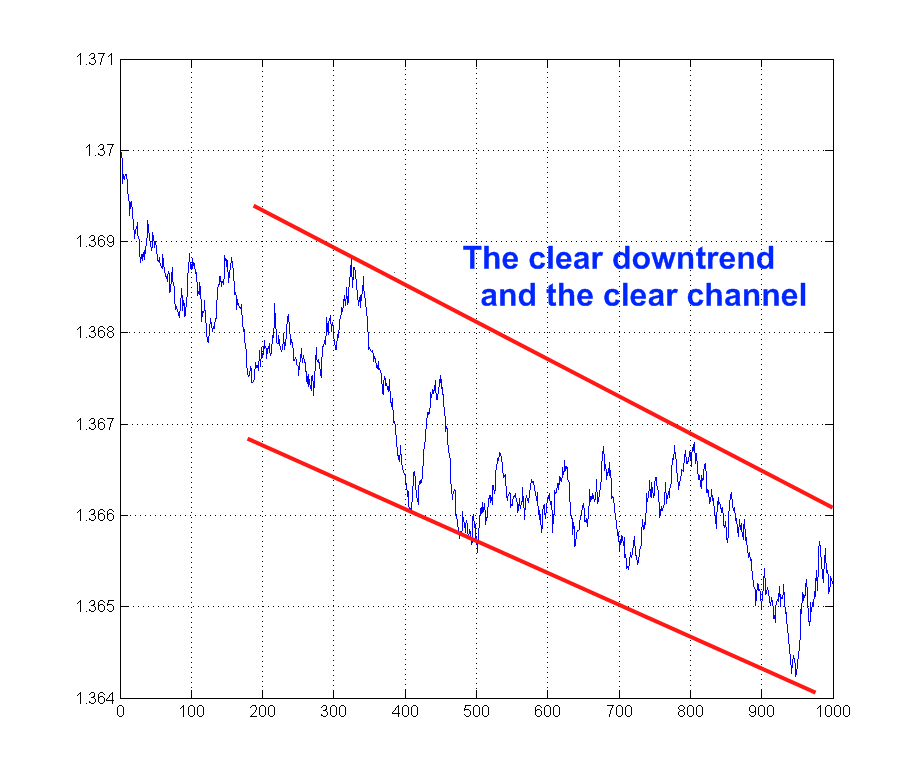
Fig. 2. A clear downtrend.
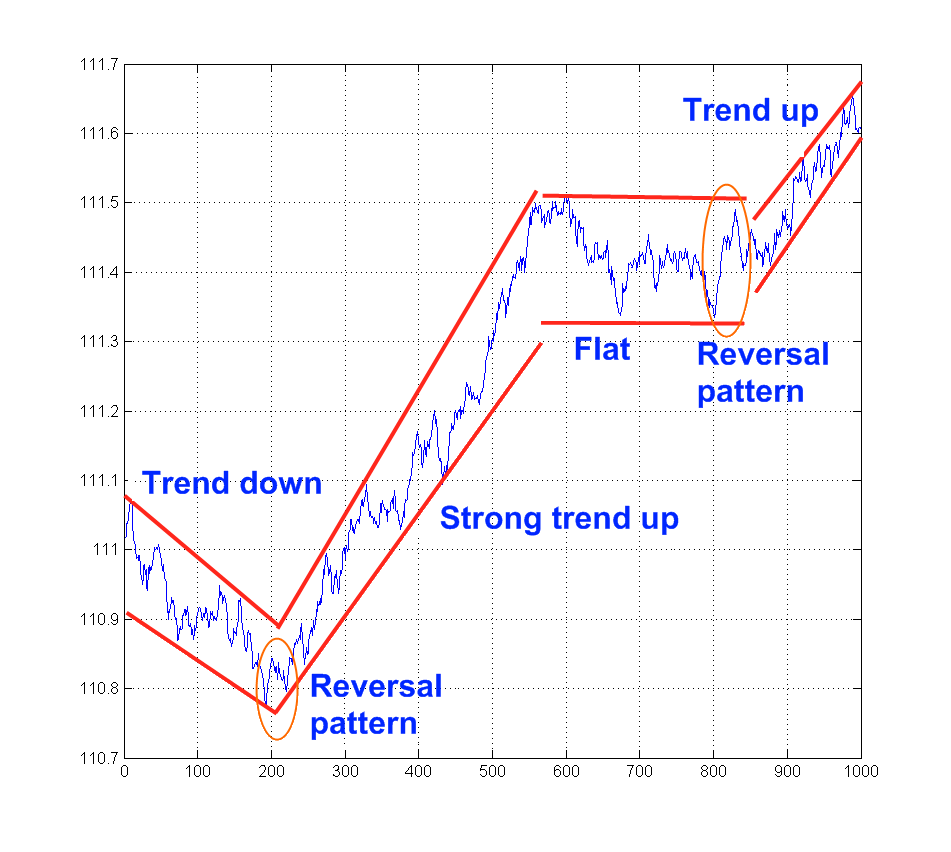 Fig. 3. Trend down, reversal, strong trend up, flat, reversal and trend up.
No profit on these “channels” and “trends” would anyone (not by chance) receive, since these are purely randomly generated processes. Moreover, they are not specially selected, but generated according to the Markov process type with the (n + 1) -th term A (n + 1) = A (n) + C * randn (), with the constants A (0) and C initially and random numbers randn (), which falling out at each iteration according to the law of normal distribution.
Having typed, say on MATLAB, in GUIDE, the form
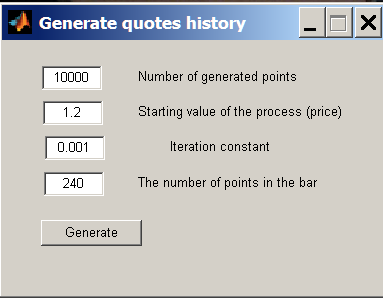
Fig. 4. Random "quotes" generator.
and the simplest code for processing its events, such as
«
% Number of generated points
N=str2double(get(handles.edit1,'String'));
x=1:N; % Timeline
% Starting value of the process (price)
Pr(1)=str2double(get(handles.edit2,'String'));
% Iteration constant
Delt=str2double(get(handles.edit3,'String'));
for i=2:N
Pr(i)=Pr(i-1)+Delt*randn();
end
sz = get(0, 'ScreenSize');
figure('Units', 'normalized', 'OuterPosition', [0 0 1 1],'Name','Price chart','NumberTitle','off')
plot(x, Pr);
grid on
% The number of points in the bar
NB=str2double(get(handles.edit4,'String'));
% The number of generated bars
N_Bar=fix(N/NB);
for j=1:N_Bar
open(j)=Pr((j-1)*NB+1);
close(j)=Pr(j*NB);
high(j)=max(Pr(((j-1)*NB+1):(j*NB)));
low(j)=min(Pr(((j-1)*NB+1):(j*NB)));
end
figure ('Units', 'normalized', 'OuterPosition', [0 0 1 1],'Name','Candlestick Chart ','NumberTitle','off')
candle(high', low',close', open', 'r'); % draw a candlestick chart (in the current axes)
grid on
»
You yourself will be able to get as many “quotation stories” as you like (you can take the differences not according to the normal law, as here, but according to any other - this will not change anything). As a result, you will get both “channels” and “trends” and breakdowns of channels and reversal patterns, etc. At the same time, however, you in principle, you will not be able to earn on knowledge of such figures (if such "quotes" in real time will be broadcast in MT). So, in accordance with our definition, all this is not trends and is not channels.
By and large, those channels, trends, etc. that many experts draw from "technical analysis" are just as useless and are simply expressions of our usual geometric way of comprehending an already existing history. You can earn money on these a posteriori drawn figures only by chance, but their clear images that confront us make us believe the opposite. These seemingly obvious “trends” and “channels” are illusory representations of the market. However, these illusions, due to our innate cliches of conceptualizing graphically representable information, seem obvious and true. But following such illusory ideas (arising akin to optical illusions) leads traders away from success.
Here are the candlestick charts generated by this program, on which, by the way, one can completely find the characteristic combinations of candles (patterns), which are consistent with the further price movement.
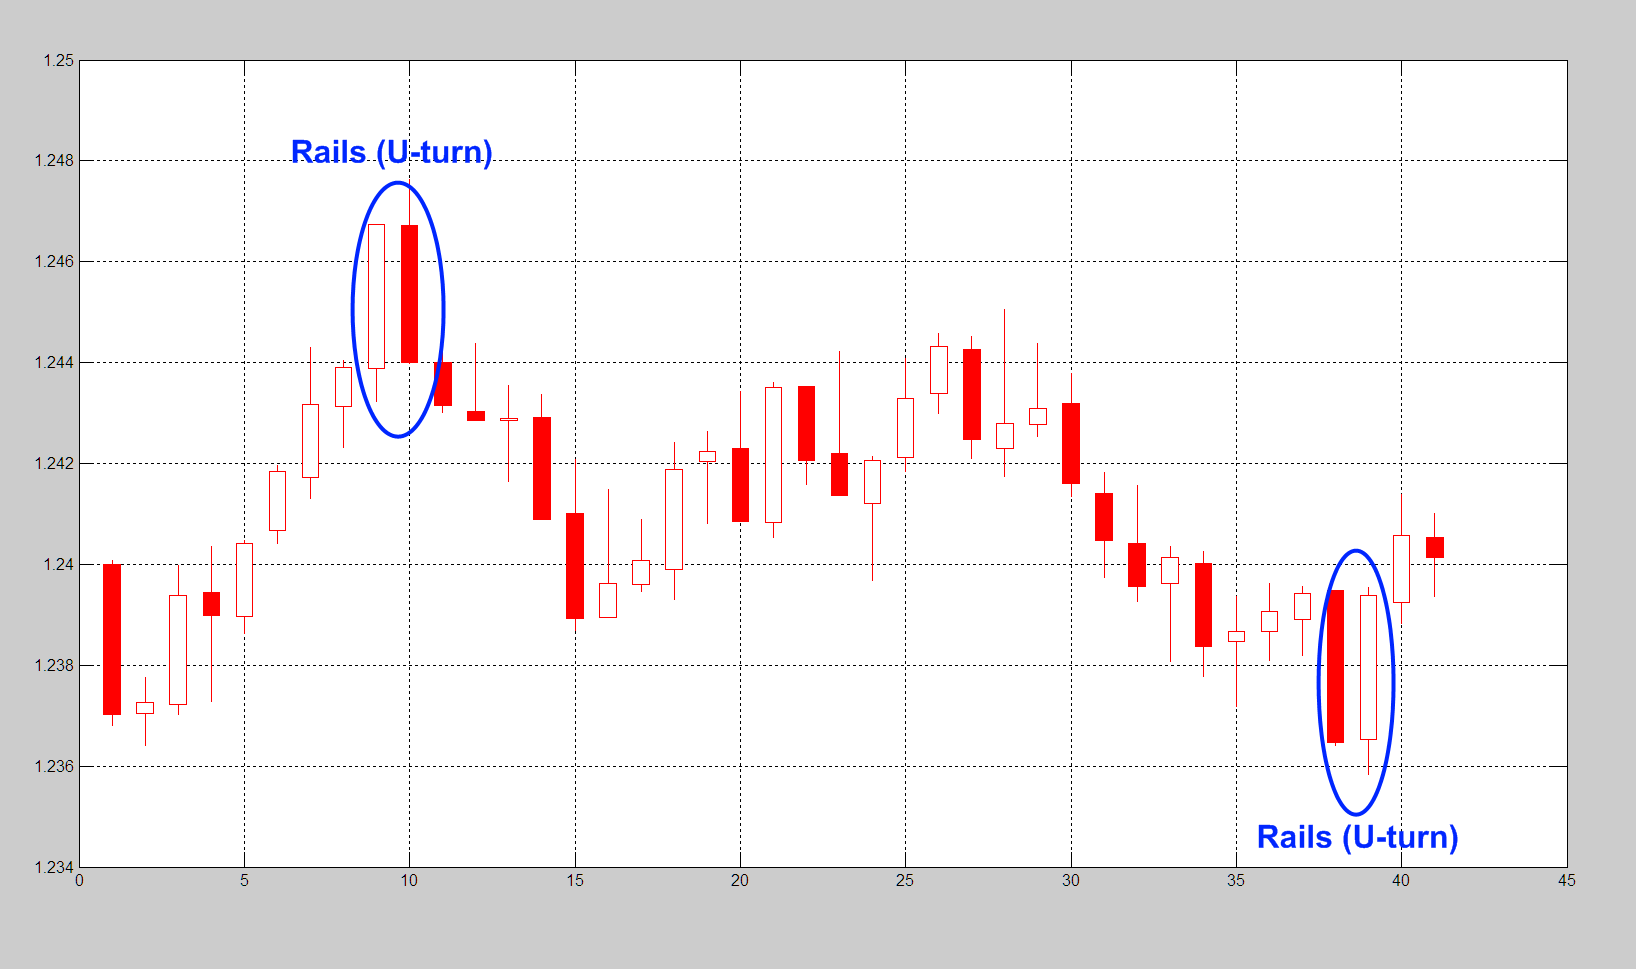
Fig. 5. Rails (U-turn).
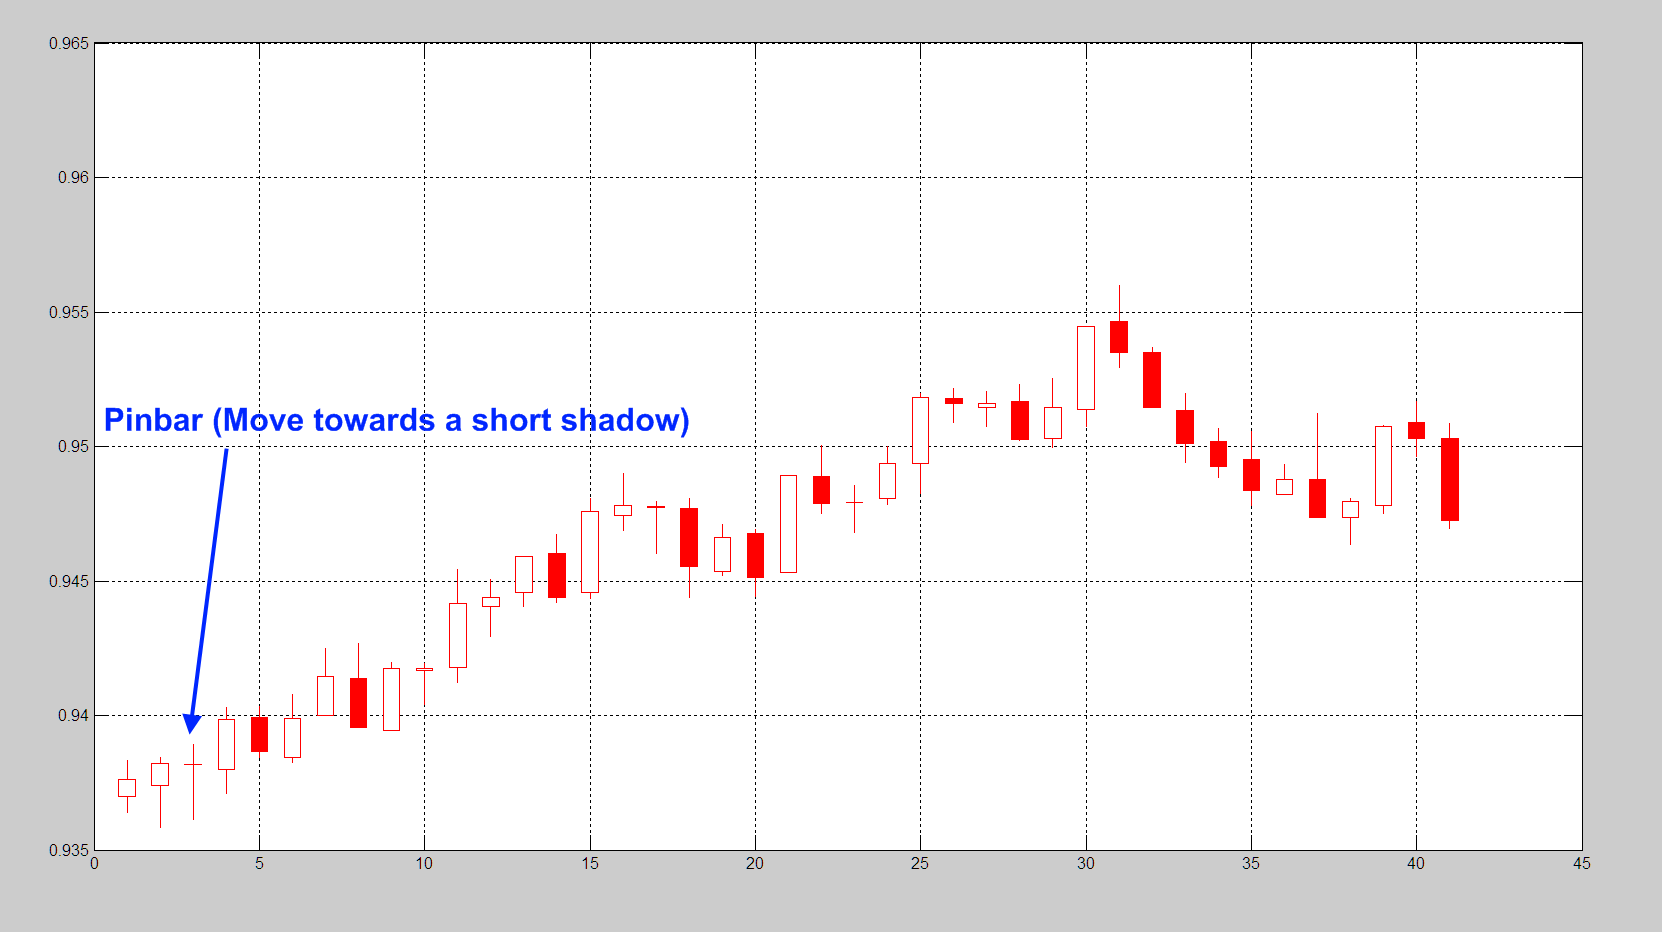
Fig. 6. Pinbar.
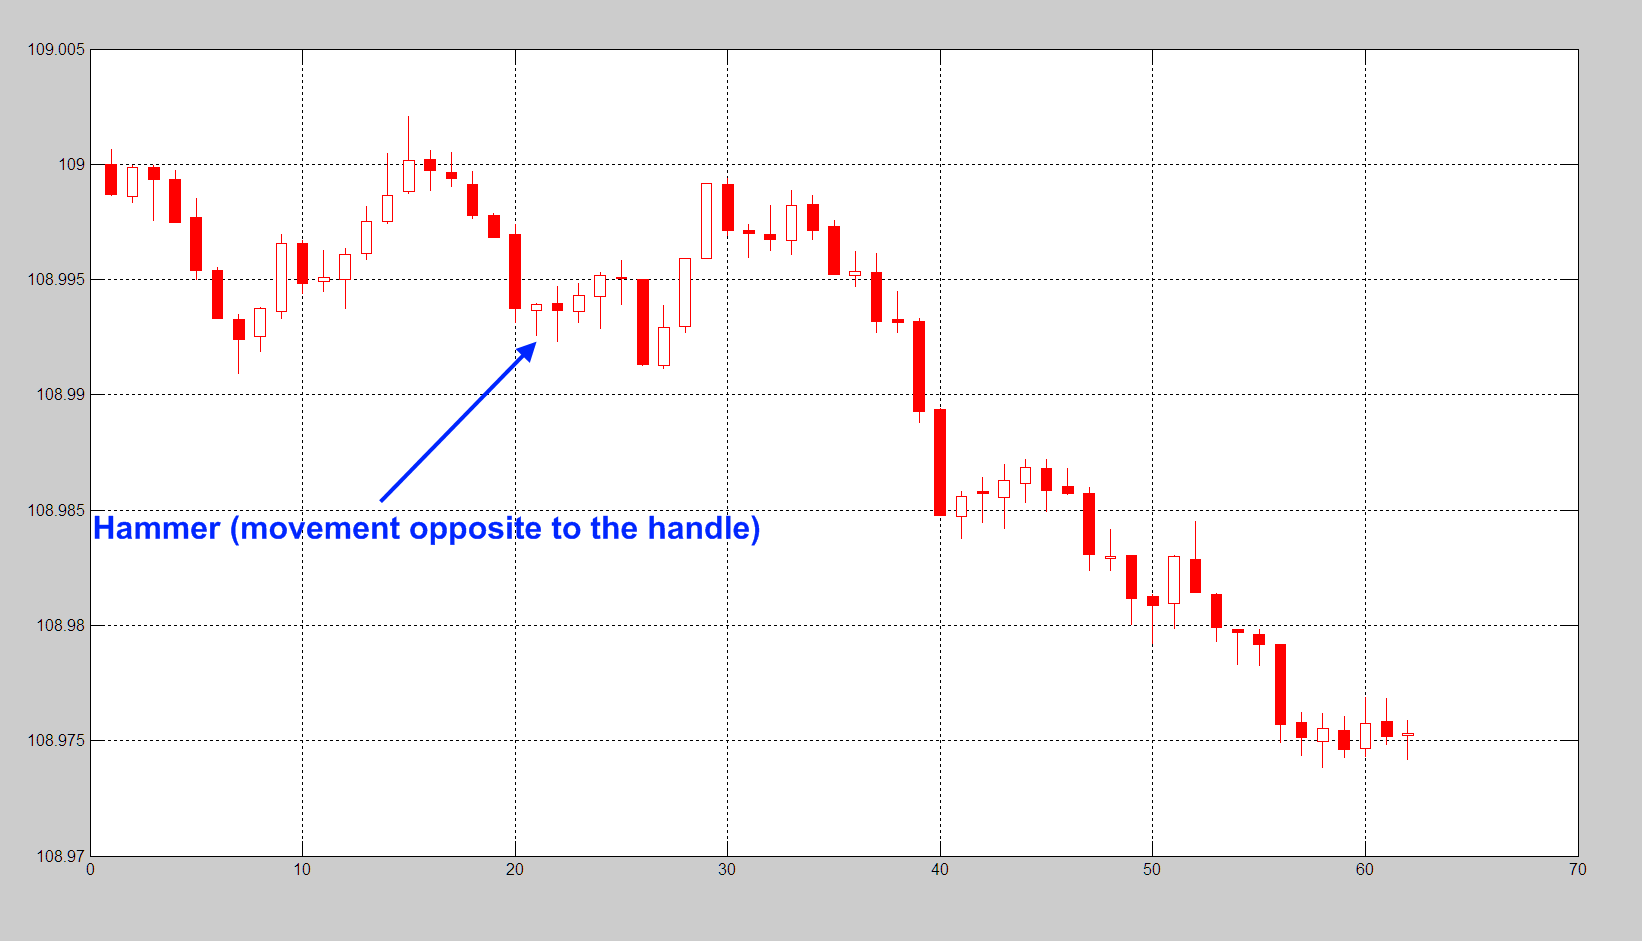
Fig. 7. Hammer.
You might think that the laws of absolute chaos appeared here. No, most likely this is just an expression of the need of our consciousness to explain everything. In this case, there is recognition on the posteriorly already existing graphic information of some signs interpreting its tendency. But this is just an illusion of explanation.
2. True trends.
But there are, of course, true market trends that turn out to be latent, on the contrary. Identification of these latent trends guarantees success; their demonstration, provision of the tools necessary for their identification and the issuance of appropriate trading recommendations is our task. To solve it, it is necessary, first of all, to get rid of all the illusions of the usual understanding of the market and approach its research from a scientific point of view.
In accordance with the statistical approach, a representative channel should be built not according to individual price spikes (which can happen to be very far from its most probable values), but based on the probability distribution of the price. Knowing the probability distribution and setting some threshold low probability of the price staying outside the channel, we can easily build this channel useful for trading.
To calculate the probability distribution of prices, the indicator Probabilities distribution of price (PDP) (or Probability distribution PRO) was created, the application of which immediately reveals to us the latent (for other indicators) microstructure of price movement.
The PDP indicator, based on the analysis of the lowest time frames (which gives significant statistics), in real time calculates the probability distribution of prices on higher time frames. The indicator algorithm is as follows. Sets the averaging interval in bars of a large time frame of the chart. The program splits the total price fluctuation for a given averaging period by seven equal intervals and calculates the frequency of price hits at these intervals. Based on these calculations, the indicator builds the probability columns, which can be displayed in the main terminal window in two ways:
-
as a color code, by the type of the visible light spectrum when the most probable values are closer to the violet area, while the least probable values are close to the red one. The intervals are colored accordingly (the order of coding of the decreasing probability by means of the color scale is specified in the settings and can be changed by users);
-
as values specifying the probability of hitting the given intervals with the corresponding color.
In the PDP indicator, a non lagging moving average is also built, the algorithm of which was developed by the author.
Figures 8-11 show the results of the PDP indicator.
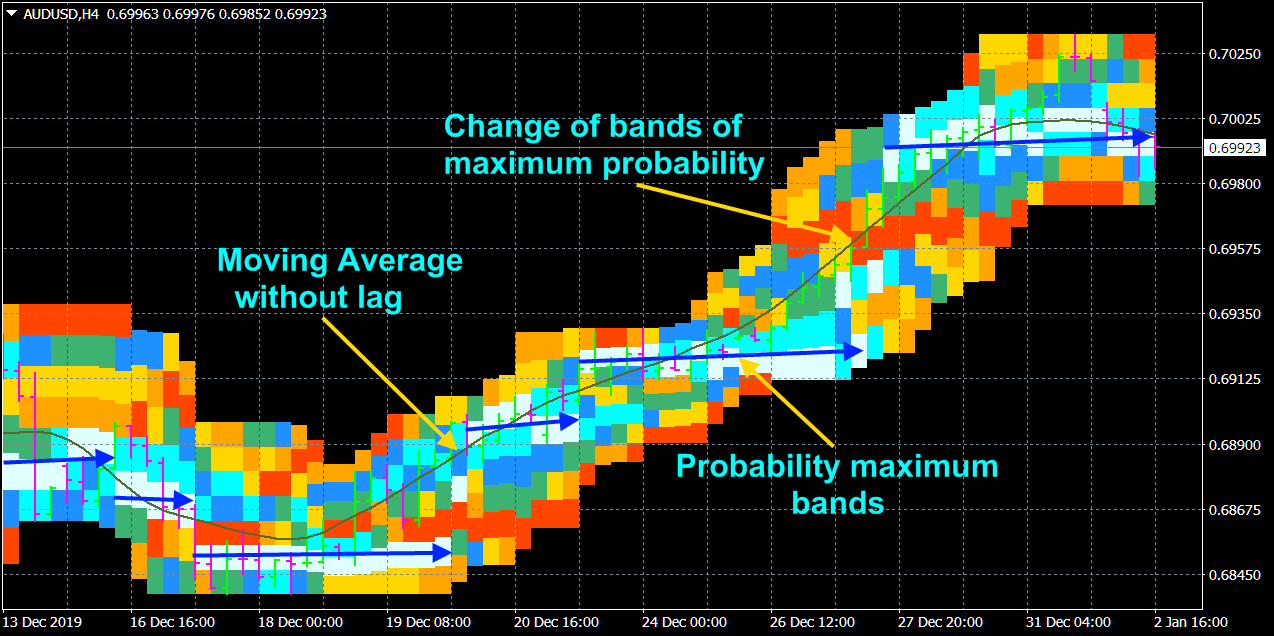
Fig. 8.

Fig. 9.
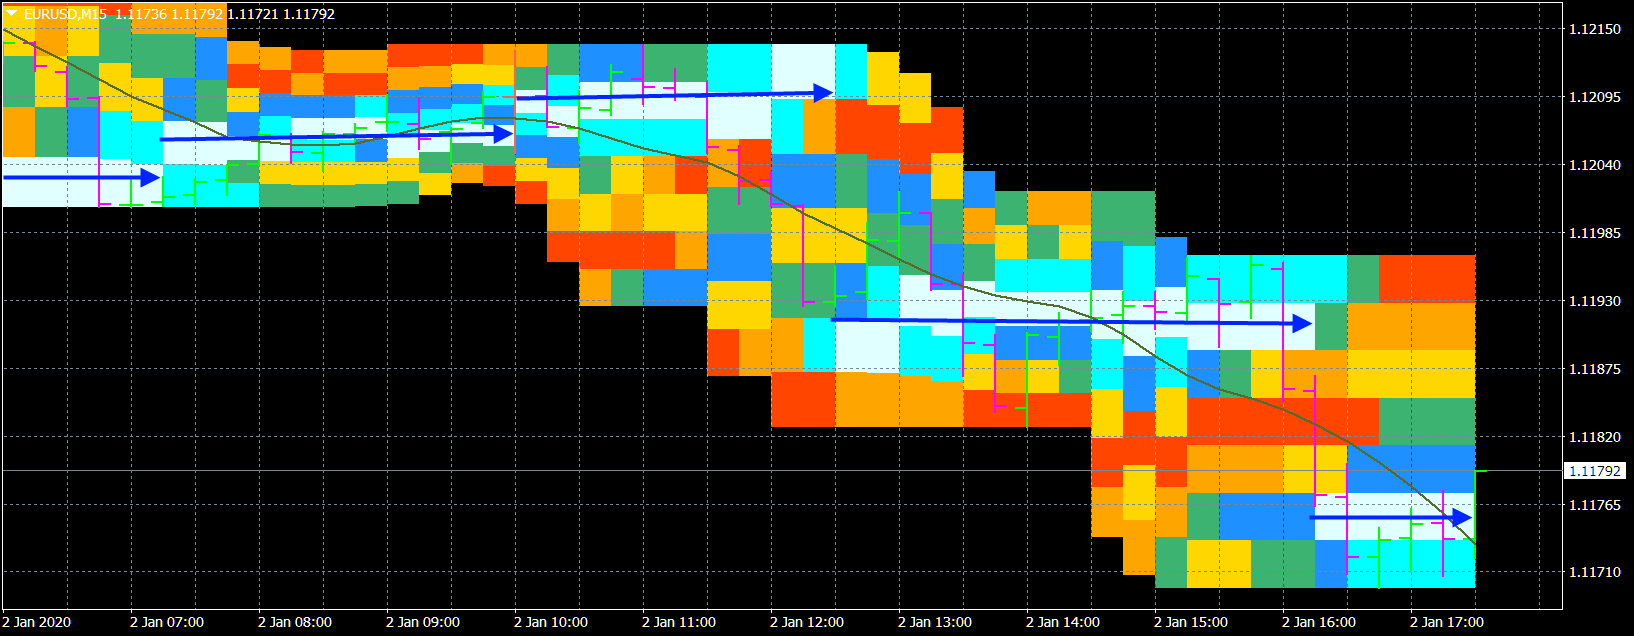
Fig. 10.
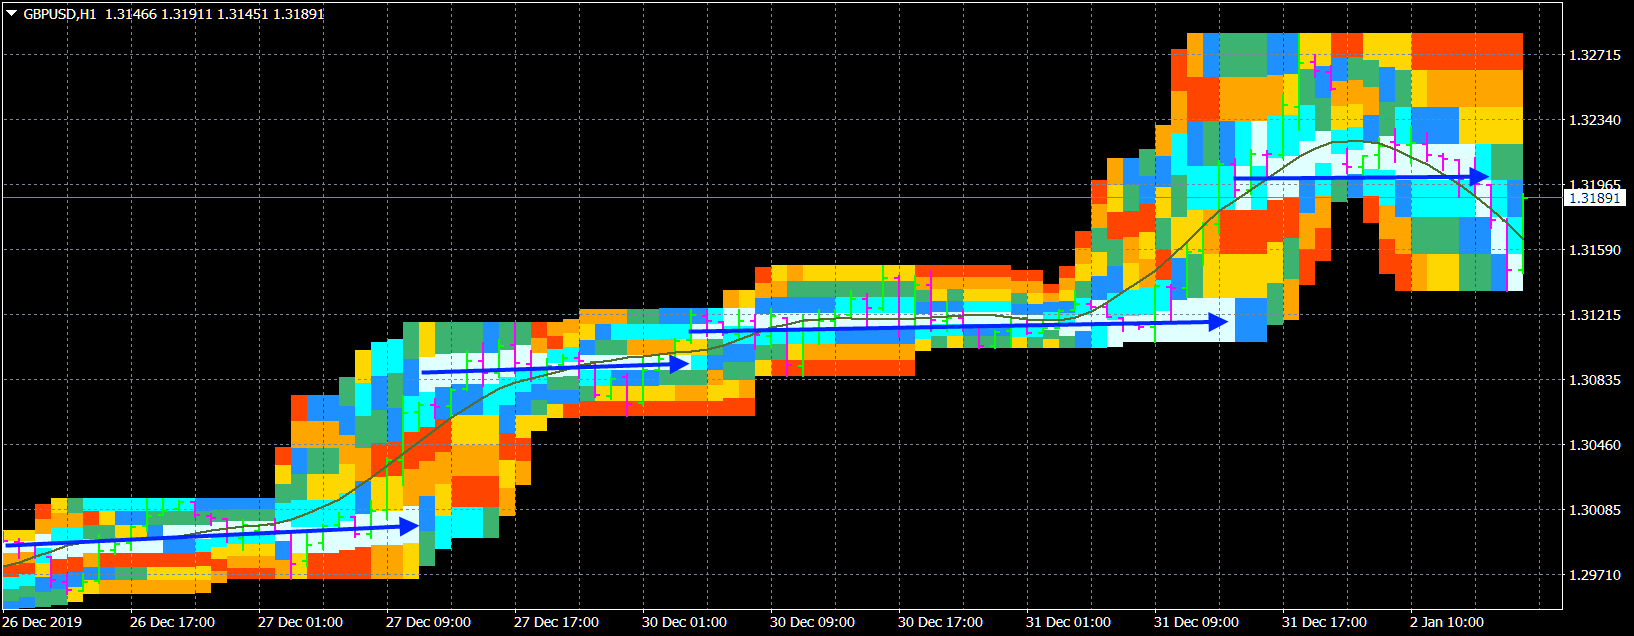
Fig. 11.
Looking at the color maps of the probability distribution, it is easy to notice that the places where the price "show up" the most, form on all time frames rather extensive horizontal bands (Figure 8-11), which are similar to discrete energy levels, when the price from one level to another passes jump, almost avoiding intermediate points, in which the probability density of its hit are sometimes minimal. This spasmodic dynamics of price movement in Figures 8-11 is marked with blue arrows.
It also follows from the found patterns of price movement that true channels are composed of lines parallel to the time axis.
The existence of such zones can be explained from a psychological standpoint, as a consequence of the habit of key market participants, which determines pricing, when they are confident in the adequacy of certain price values determined at a given moment. This key market participants try set this price for some time, which continues until important events occur or major currency transactions.
From the analytical point of view, the existence of such price zones and their isolation from each other is also understandable, since highly nonlinear equations, in principle, describe such complex systems as the market, have huge sets of sharply differing solutions that jump and unpredictably replace each other in points of bifurcation, after which the price only fluctuates around such solutions until the next bifurcation.
In general, this picture is fully consistent with modern ideas about the leaping dynamics of the market, which in brief are as follows. The price can experience large and really unpredictable (for the bulk of people) jumps (1) in case of strong events (important news about: economic regulations, cataclysms, major business and political events, etc.). In this case, relaxation of the oscillations caused by such phenomena occurs with a time proportional to ~ 1 / N. But the market, as it were, lives “its own life” (where the processes of its self-organization take place), experiencing (2) its own (not caused by external influence) and sometimes no less jumps, which are even characterized by another relaxation law Sqrt (1 / N ). Note that the relaxation law Sqrt (1 / N) is observed much more often than the relaxation ~ 1 / N. Therefore, the market operates mainly according to its own laws.
The time of the onset of leaps of the first type can be judged by the calendar of events and other sources of political and economic news, i.e. by statistical indicators.
The possibility of the occurrence of leaps of the second type is established by certain statistical characteristics, which are identified by many indicators presented here with optimal filtering of market noise.


")
")