A bullish engulfing pattern occurs in the candlestick chart of a currency pair when a large bull candlestick fully engulfs a smaller bear candlestick from the period before. This pattern during a downtrend is thought to signal the beginning of a bullish trend.
We have all seen a currency pair enter the overbought or oversold territory and stay there for long periods of time. What this indicator does is gives you the emphasis. So if you are looking for reversals then you may want to take notice when oversold territory is entered into with a bullish engulfing candle.
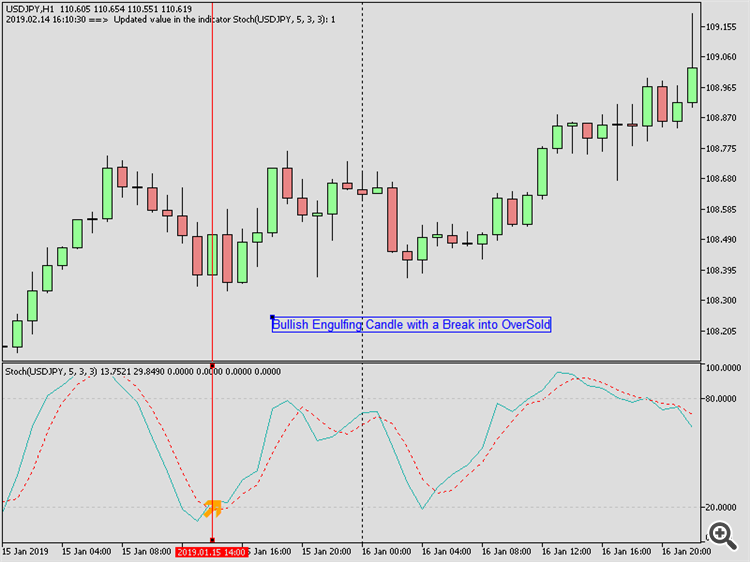 https://www.mql5.com/en/charts/9761182/usdjpy-h1-tw-corp-bullish-engulfing-with-oversold-cross
or you could spot when a bearish engulfing candle forms while entering the overbought territory.
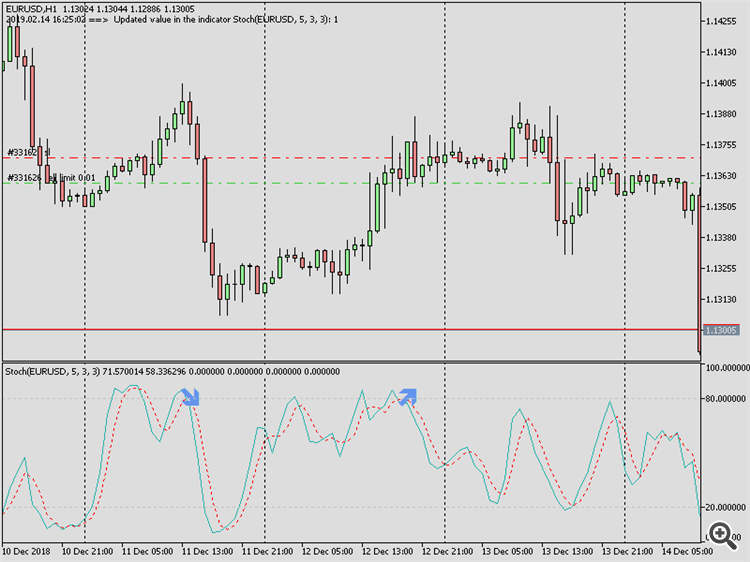 https://www.mql5.com/en/charts/9761097/usdjpy-h1-tw-corp-bearish-overbought-cross-along-with-a-bullish
If instead you are trend focused and you wish to look for continuations of the trend then you would want to check for bullish engulfing candles while entering overbought hoping that this will just be the beginning of a long tenure in overbought territory.
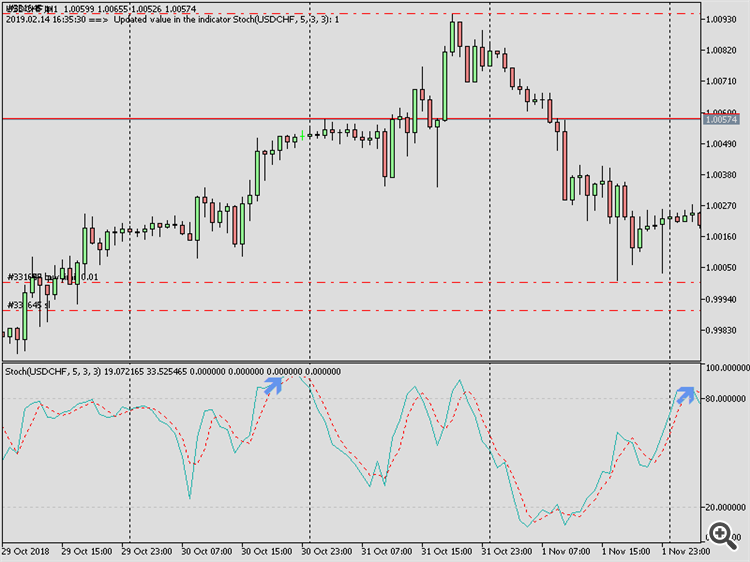 https://www.mql5.com/en/charts/9761338/usdchf-h1-tw-corp-bull-engulf-overbought
Going the other way we have a bearish engulfing candle entering oversold.
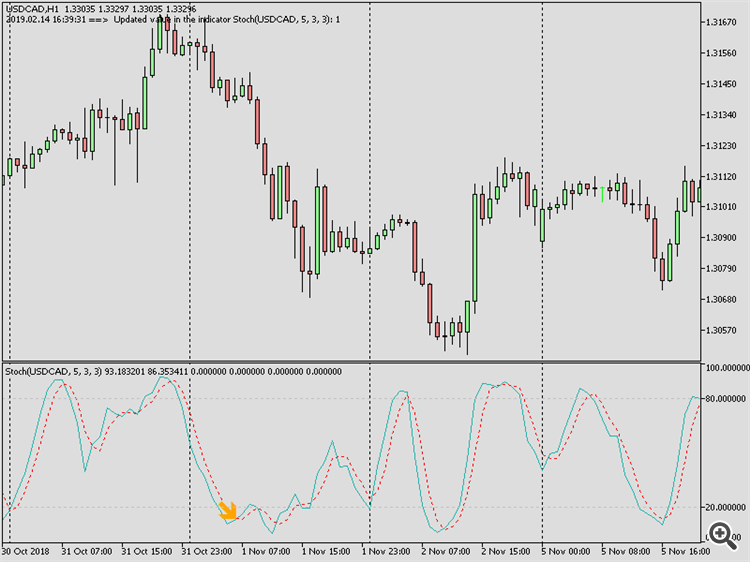 https://www.mql5.com/en/charts/9761357/usdcad-h1-tw-corp-bear-engulf-oversold
And there you have it, a case for using engulfing candles with the stochastic indicator. You can find the indicator for free on the codebase here https://www.mql5.com/en/code/24645
Or download it from the market here https://www.mql5.com/en/market/product/35875 while it's free.
