

About:
QQE Dual Pulse is best for people who are using QQE with their existing trading strategies to validate trends.
It is an oscillator that combines two QQE calculations with Bollinger Band filtering to identify high-probability trading signals.
This indicator helps traders spot momentum shifts and trend changes with reduced false signals.
What is QQE and QQE Mod?
QQE original: is an enhanced version of the RSI (Relative Strength Index) that applies additional smoothing and dynamic thresholds.
Unlike standard RSI, QQE adapts to market volatility by using ATR (Average True Range) calculations to create dynamic support and resistance levels.
QQE Mod:
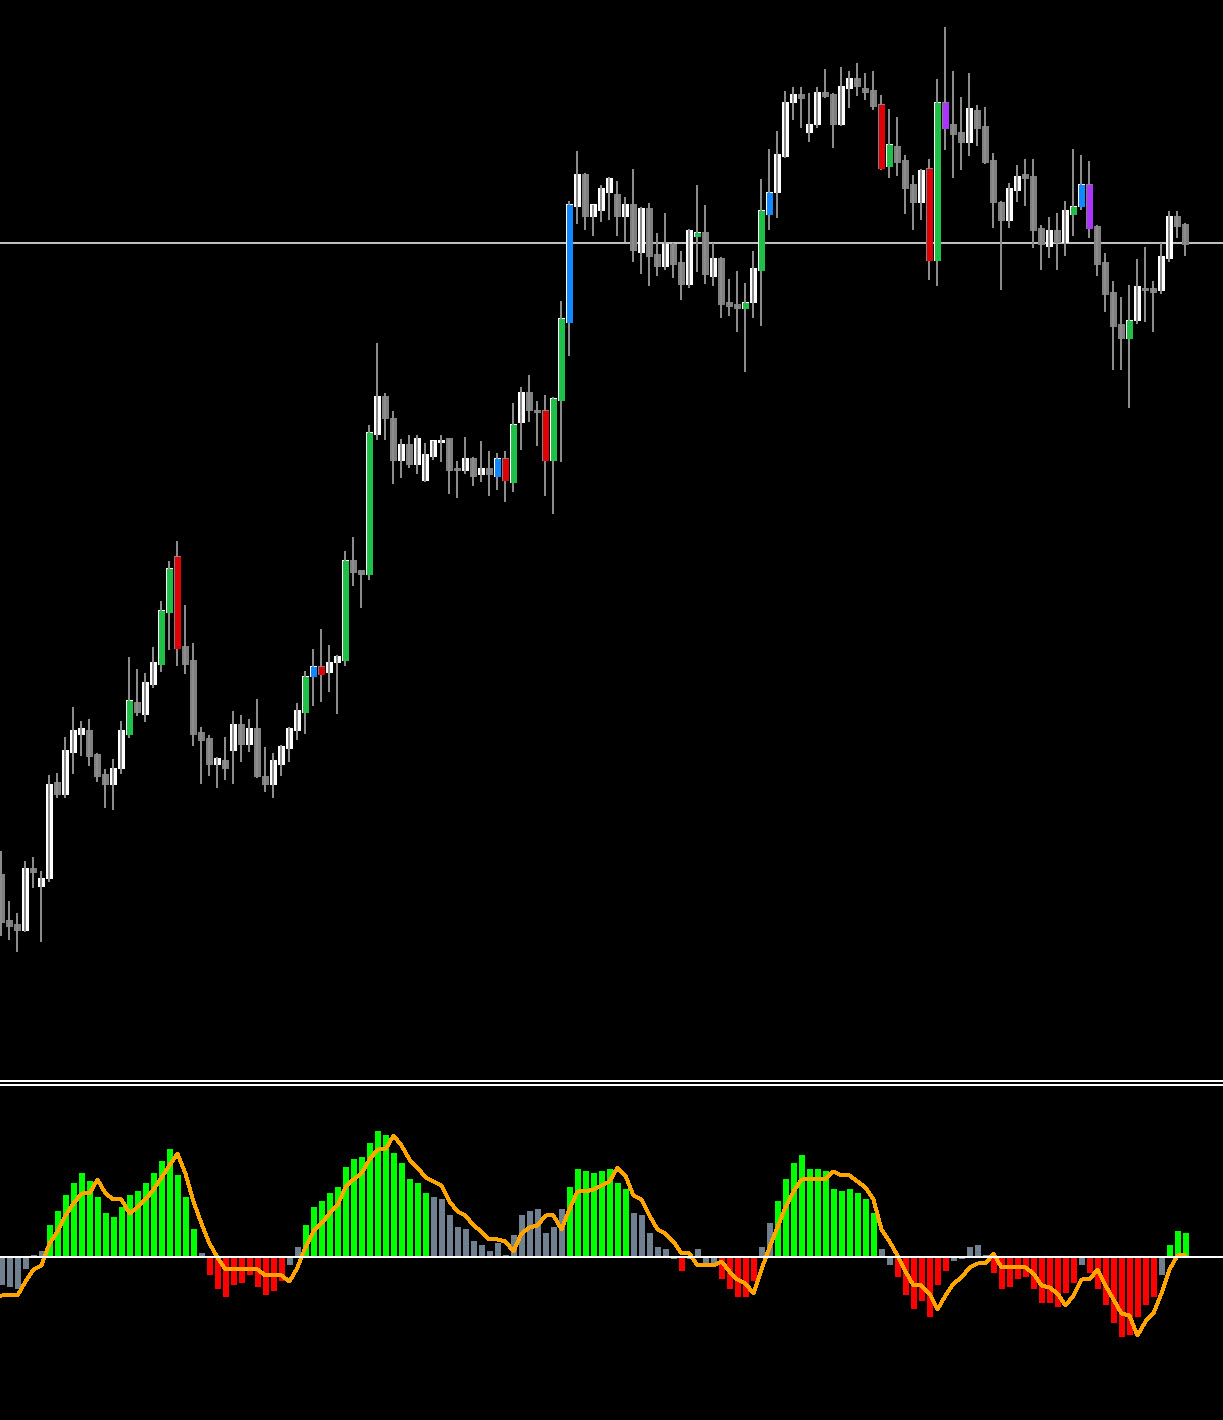
It uses two QQEs, one displayed as a histogram and the other hidden, to further enhance signal reliability.
If Smoothed RSI crosses outside Bollinger bands, then the histogram will be colored, else it will be greyed out.
Components:
Signal Interpretation
Primary QQE System is for Trend confirmation and momentum analysis
Strong Signals (Colored Bars)
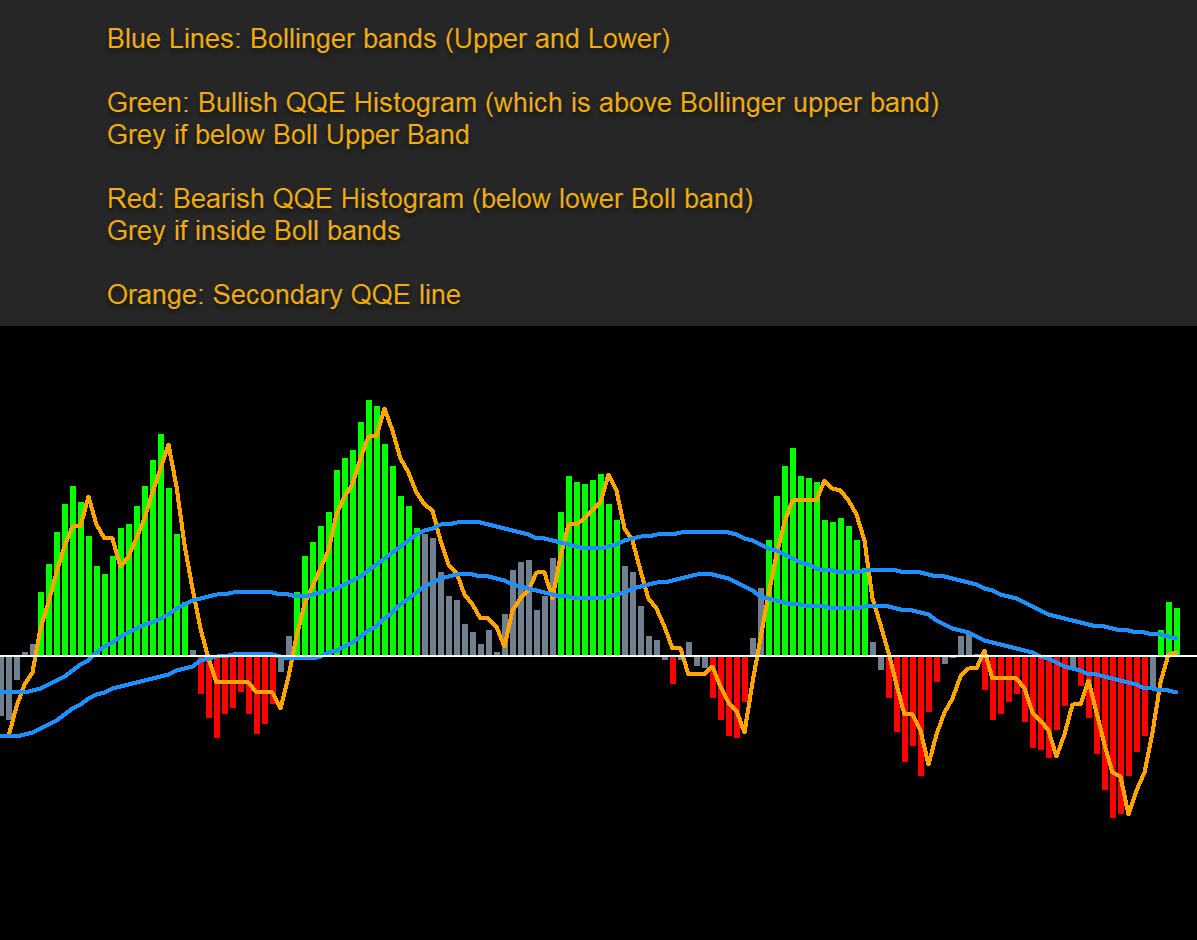
- Green Bars: Bullish signal - Secondary QQE above threshold AND Primary QQE above Bollinger upper band
- Red Bars: Bearish signal - Secondary QQE below threshold AND Primary QQE below Bollinger lower band
- Gray Bars: No clear directional bias
- Occurs when Secondary QQE is within threshold range
- Or when Bollinger Band conditions aren't met
Secondary QQE System is for Signal generation and entry timing
Zero Line Crosses- Above Zero: Generally bullish momentum
- Below Zero: Generally bearish momentum
- Zero Cross: Potential momentum shift (optional alerts available)
Use Primary RSI and Secondary RSI on chart only when you need to see the RSI lines to compare.
Primary RSI is used to determine if we're in extreme conditions via Bollinger Bands. To color the histogram red/green
Secondary RSI creates the actual colored histogram bars you see.
Key Settings Explained
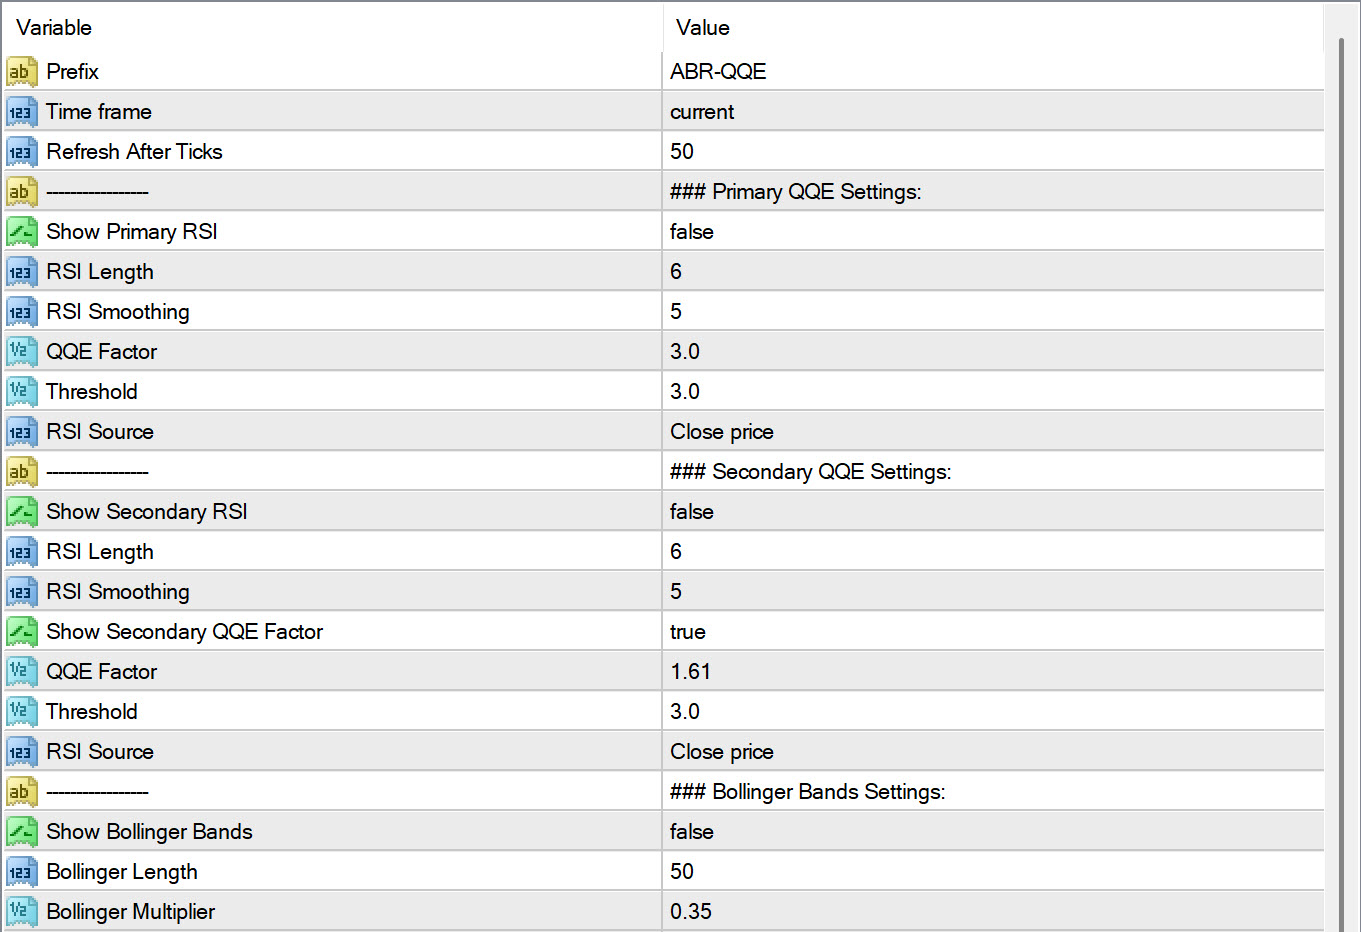
Primary QQE Settings - RSI Length (6): Period for RSI calculation
- RSI Smoothing (5): EMA smoothing of RSI values
- QQE Factor (3.0): Multiplier for ATR-based bands
- Threshold (3.0): Minimum level for signal validation
- QQE Factor (1.61): Lower sensitivity for trend line
- Other settings typically match primary for consistency
- Length (50): Period for moving average calculation
- Multiplier (0.35): Standard deviation multiplier (lower = tighter bands)
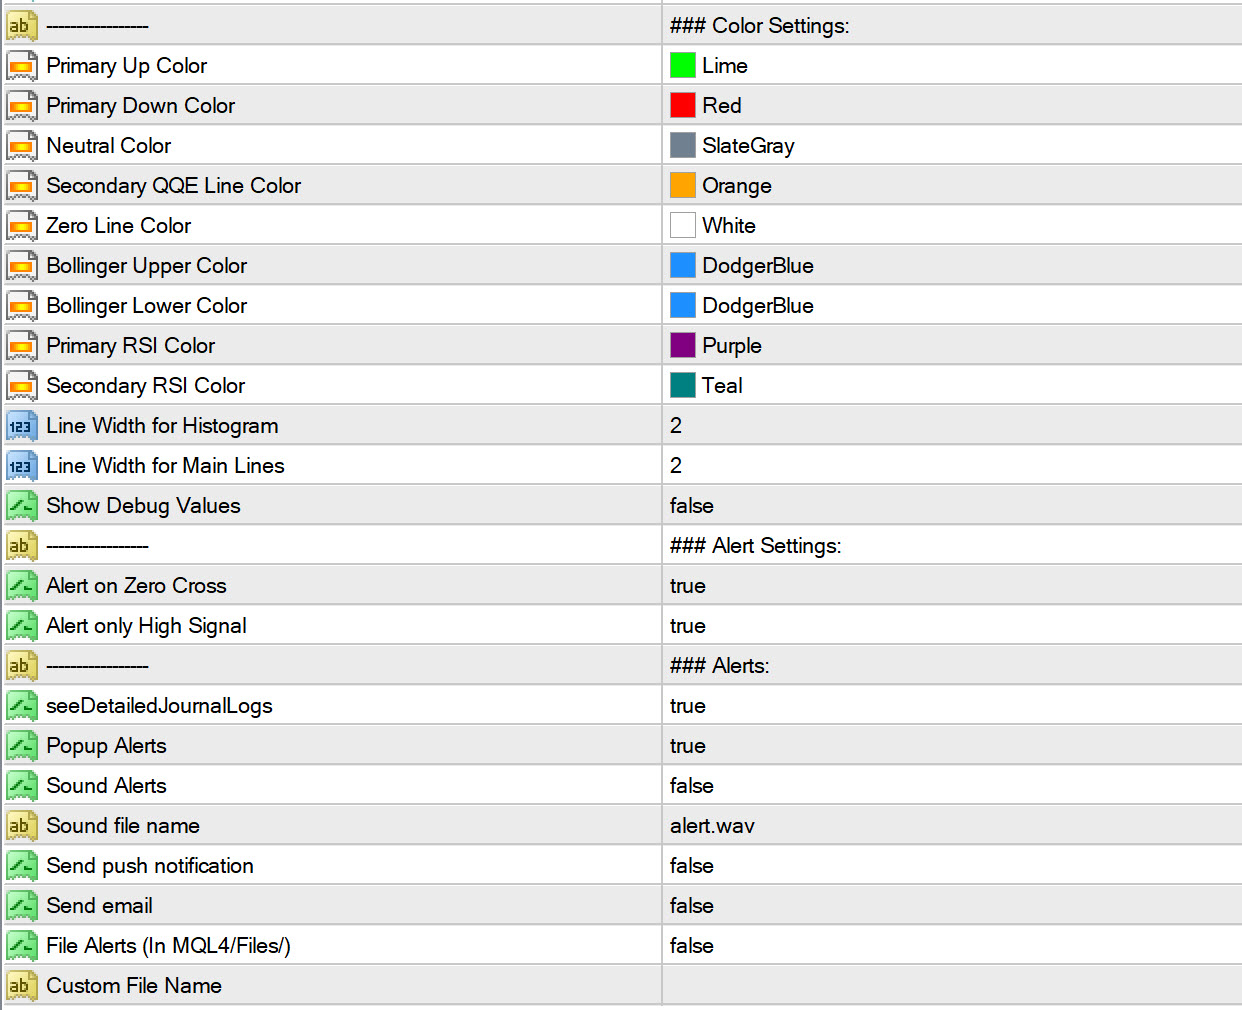
All colors are customizable.
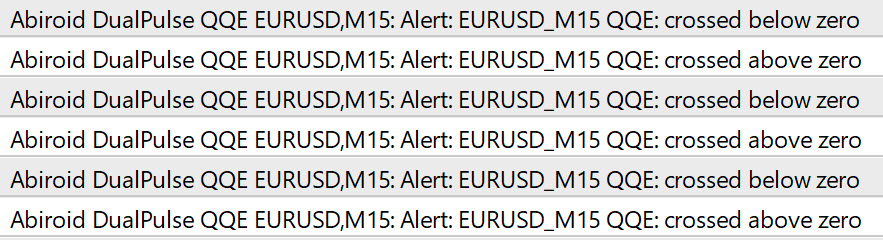
Alerts:
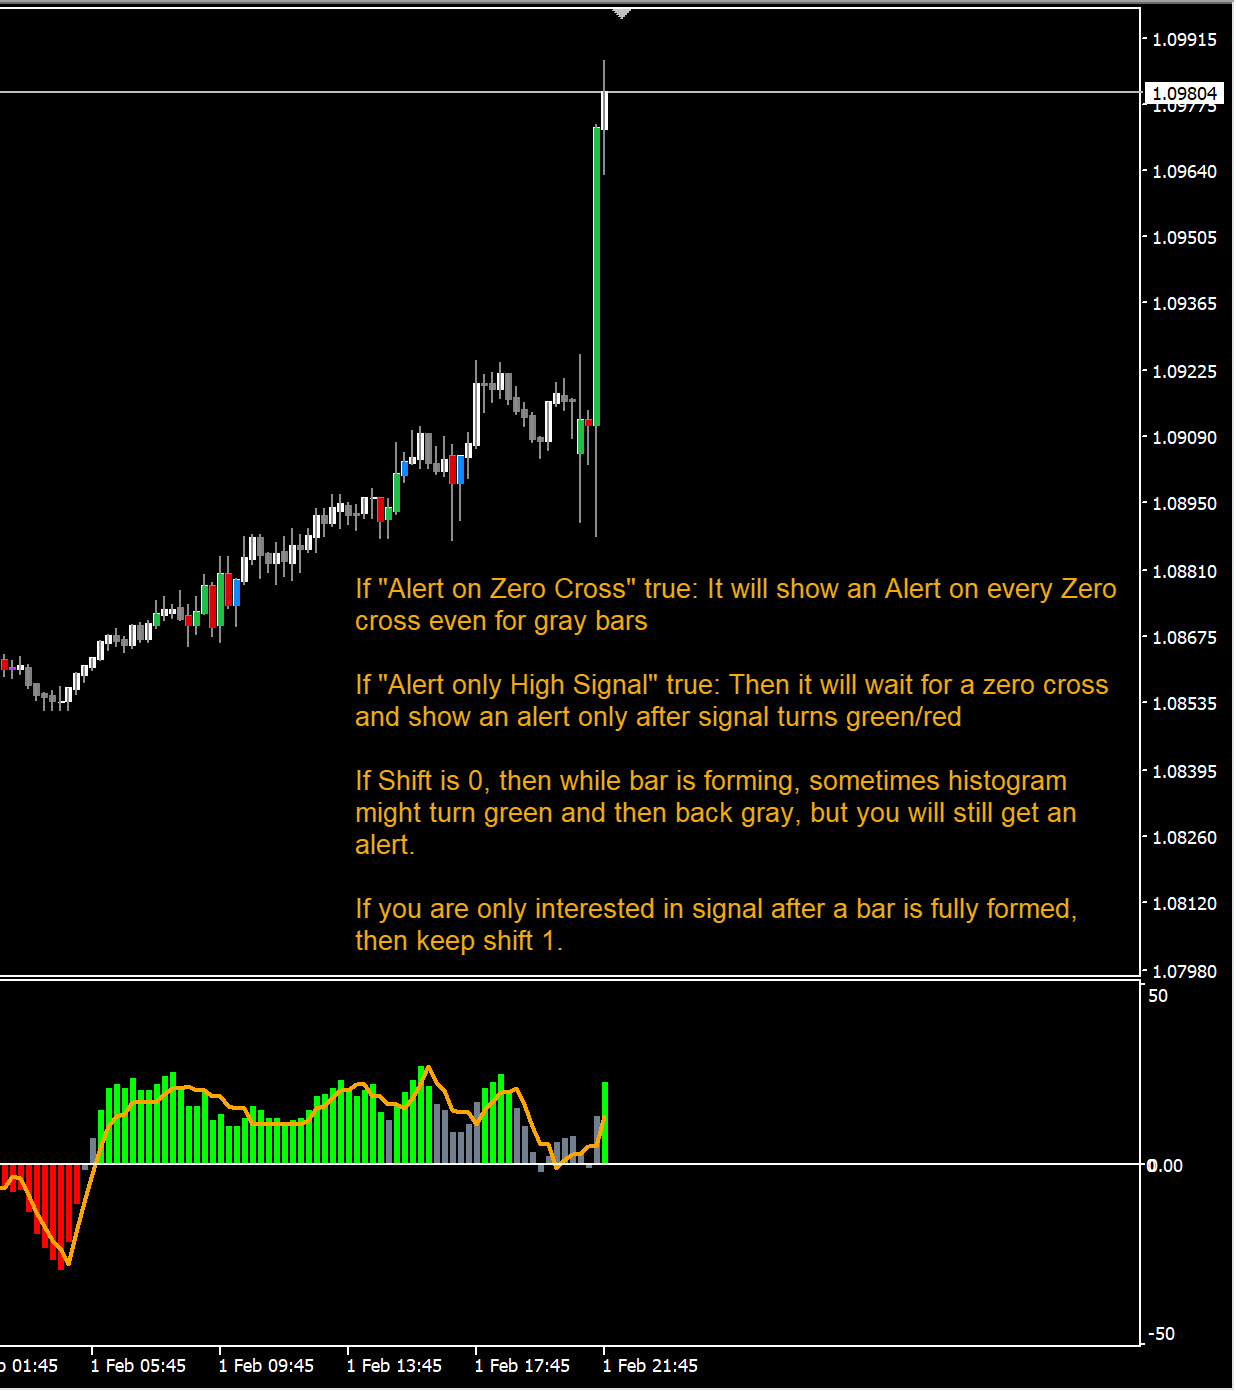
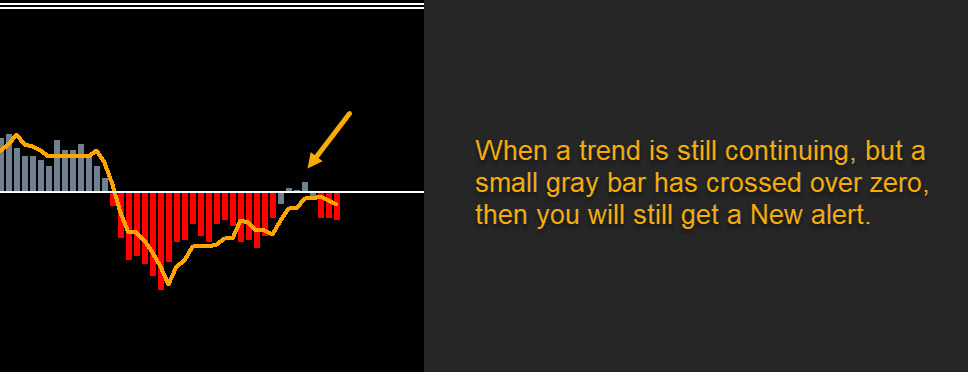
Currently alerts are only for the Red/Green histogram switching. There are no alerts for the secondary QQE orange line.
Conclusion:
- Watch the histogram colors: Red/Green bars indicate high-confidence signals
- Monitor the orange line: Shows secondary trend direction
- Note zero line position: Indicates overall momentum bias
- Look for convergence: When both QQE systems align, signals are stronger
You can use the Indicator to find ongoing trend for vaildation, or to see when trend is possibly slowing down. Or for reversals and it will help you filter out market noise.


")
![[XAUUSD]: Weekly Liquidity Activation Points (timings), June 22-26, 2026](https://c.mql5.com/6/1013/splash-preview-771790.png "[XAUUSD]: Weekly Liquidity Activation Points (timings), June 22-26, 2026")
")