
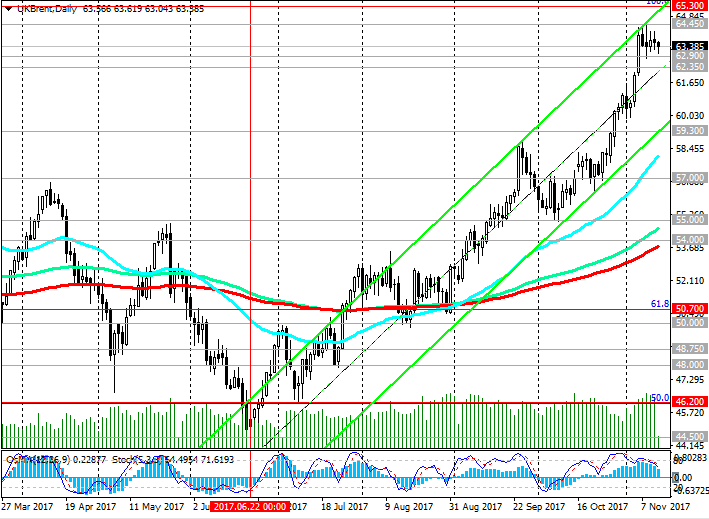
There remains a strong positive impulse of a fundamental nature. If growth continues, the next target is resistance level 65.30 (Fibonacci level 100% correction to decline from the level of 65.30 from June 2015 to the absolute minimums of 2016 near the mark of 27.00).
Technical indicators (OsMA and Stochastic) on the daily, weekly, monthly charts are still on the buyers side. Long positions are preferred.
Consideration of short positions is possible after the return of the price under the support level of 62.35 (EMA200 on the 1-hour chart). The immediate goal is the support level of 59.30 (EMA200 on the 4-hour chart).
And only if the price returns to the level of 55.00 (EMA200 on the weekly chart) will the risks of resuming the downtrend increase with targets at 54.00 (EMA200 on the daily chart), 50.70 (Fibonacci level 61.8%) 50.00 (lows in August), 48.75, 48.00 , 46.20 (Fibonacci 50%), 44.50 (lows of the year), 41.70 (the Fibonacci retracement level of 38.2% of the correction to the decline from the level of 65.30 since June 2015).
Support levels: 62.90, 62.35, 62.00, 61.50, 60.00, 59.30, 58.80, 58.00, 57.00, 56.20, 55.55, 55.00, 54.70, 53.50, 52.20, 50.70, 50.00
Resistance levels: 64.00, 64.45, 65.00, 65.30, 66.00
*)An advanced fundamental analysis is available on the Tifia Forex Broker website at tifia.com/analytics
Trading scenarios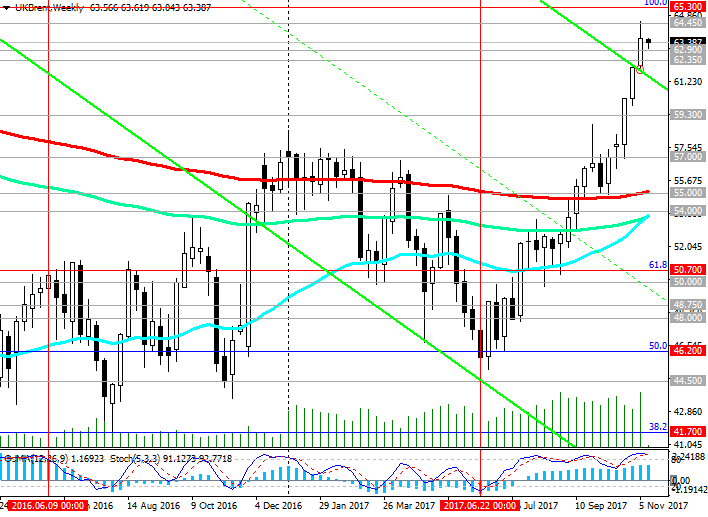
Sell Stop 62.30. Stop-Loss 64.50. Take-Profit 62.00, 61.50, 60.00, 58.80, 58.00, 57.00, 56.20, 55.55, 55.00, 54.70, 53.50, 52.20, 50.70, 50.00
Buy Stop 64.50. Stop-Loss 62.30. Take-Profit 65.00, 65.30, 66.00
*) For up-to-date and detailed analytics and news on the forex market visit Tifia Forex Broker website tifia.com


")
![[XAUUSD]: Weekly Liquidity Activation Points (timings), June 22-26, 2026](https://c.mql5.com/6/1013/splash-preview-771790.png "[XAUUSD]: Weekly Liquidity Activation Points (timings), June 22-26, 2026")
")