
EURUSD Technical Analysis 2016, 16.10 - 23.10: bearish breakdown or ranging for direction
16 October 2016, 18:11

14
360
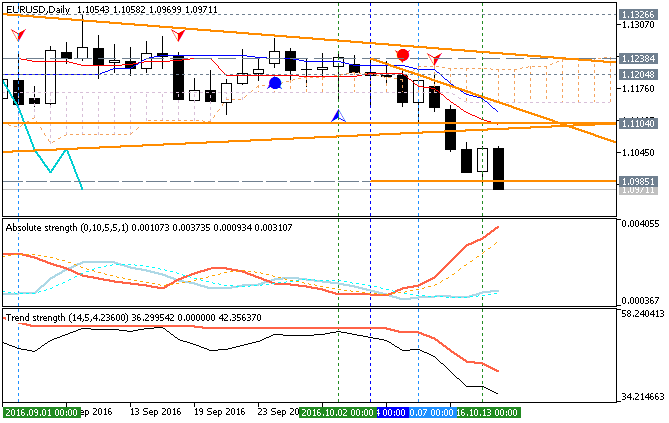
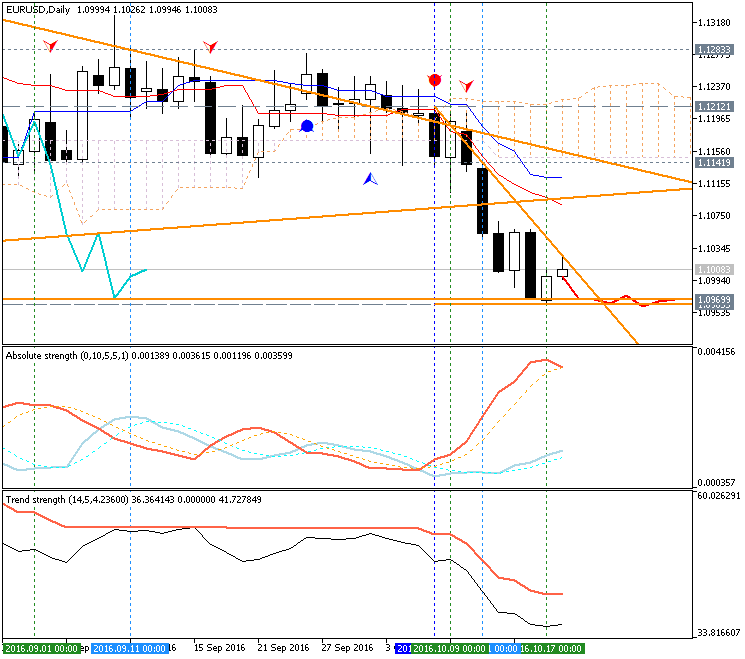
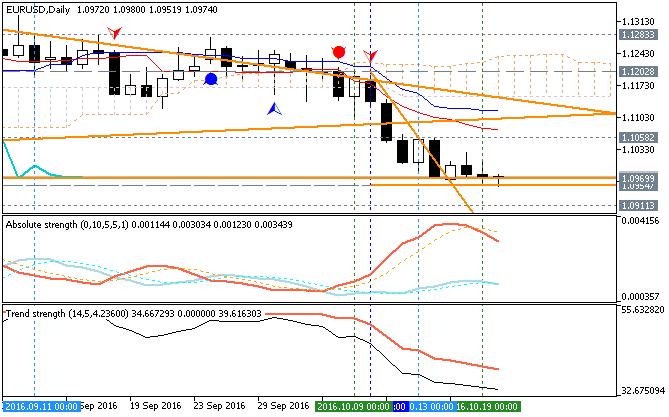
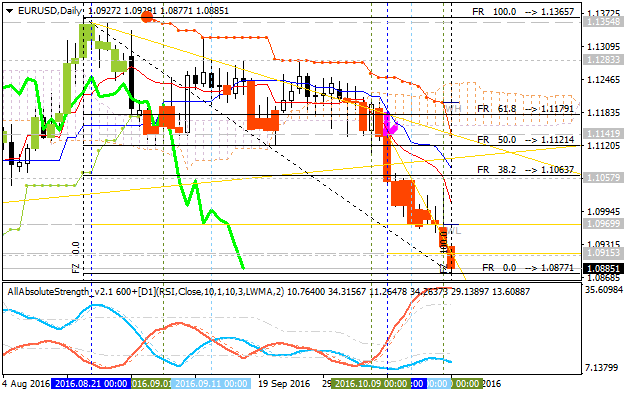
Daily price
is on primary bearish market condition located below Ichimoku cloud and
below Senkou Span line which is the virtual border between the primary
bullish and the primary bearish trend on the chart. The price is
breaking 1.0985 support level together with descending triangle pattern
to below for the bearish trend to be continuing with 1.0911 nearest
bearish target to re-enter.
Chinkou Span line is located below
the price for the bearish trend to be continuing, Absolute
Strength indicator and Trend Strength indicator are evaluating the
trend as a primary bearish market condition in the near future.
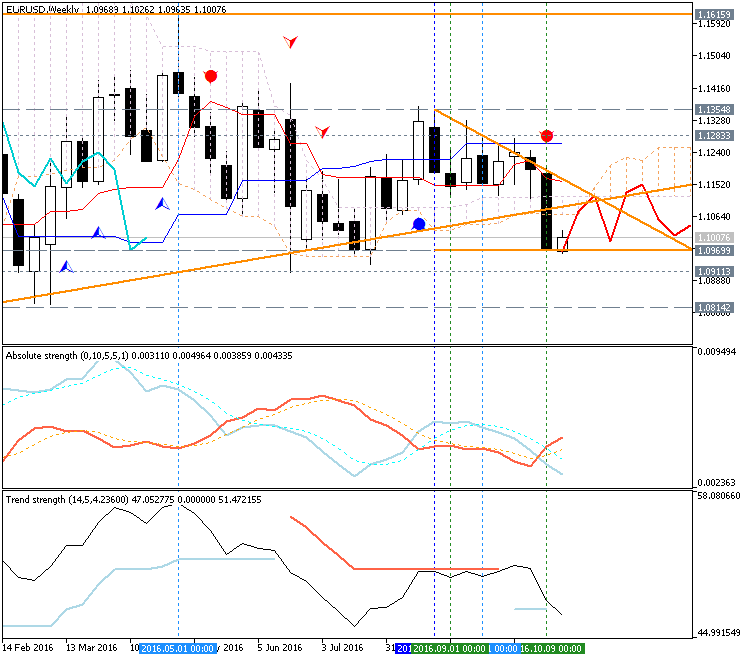
If D1 price breaks 1.1238 resistance level on close bar from below to above so the reversal of the daily price movement from the primary bearish to the primary bullish market condition will be started.
If not so the price will be on bearish ranging within the levels.
- Recommendation for long: watch close D1 price to break 1.1238 for possible buy trade
- Recommendation
to go short: watch D1 price to break 1.0911 support level for possible sell trade
- Trading Summary: bearish
| Resistance | Support |
|---|---|
| 1.1238 | 1.0985 |
| 1.1326 | 1.0911 |
SUMMARY : bearish
TREND : breakdown


")

