
AUDUSD Technical Analysis 2016, 31.07 - 07.08: daily bullish breakout
30 July 2016, 13:28

1
212
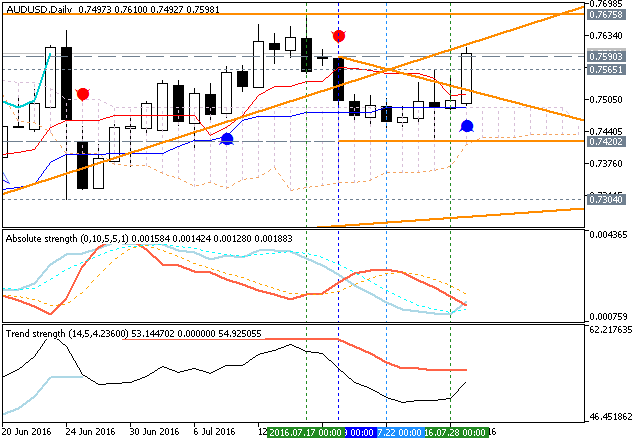
Daily price is located above Ichimoku cloud in the bullish area of the chart: the price is on bullish breakout to be started on open D1 bar for now with the symmetric triangle pattern to be formed by the price for the direction. The price is located within the following key support/resistance levels:
- 0.7590 resistance level located above Ichimoku cloud in the bullish area of the chart, and
- 0.7420 support level located below Ichimoku cloud in the beginning of the bearish trend to be started.
Absolute Strength indicator is evaluating the trend as the primary bullish to be resumed.
If D1 price breaks 0.7590 resistance level on close bar from below to above so the primary bullish trend will be resumed with 0.7675 final bullish target.
If not so the price will be on ranging bullish within the levels.
- Recommendation for long: watch close D1 price to break 0.7590 for possible buy trade
- Recommendation
to go short: watch D1 price to break 0.7420 support level for possible sell trade
- Trading Summary: bullish
| Resistance | Support |
|---|---|
| 0.7590 | 0.7420 |
| 0.7675 | 0.7304 |
SUMMARY : breakout


![[Two Different Approaches to Market Timing]: The Spiral Calendar and the VISTmany Research Project](https://c.mql5.com/6/1012/splash-preview-771691.png "[Two Different Approaches to Market Timing]: The Spiral Calendar and the VISTmany Research Project")

