Brent: The Month Started with the Declining Price. Technical Analysis as of 01.06.2016
Brent: The Month Started with the Declining Price. Technical Analysis as of 01.06.2016
Overview and dynamics
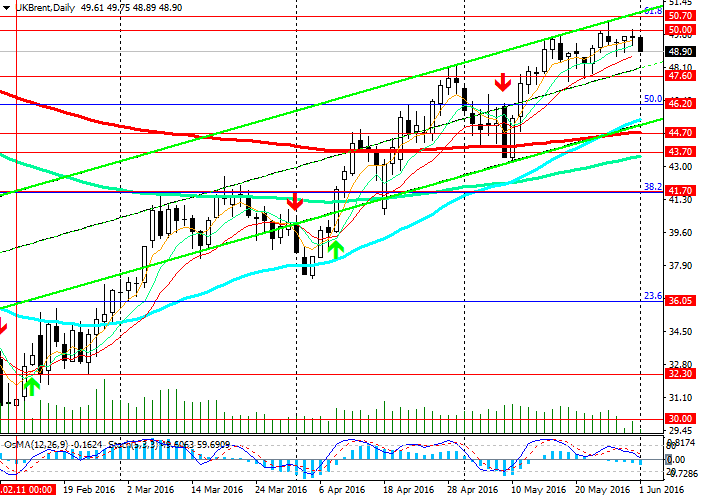
Since the opening of today's trading day, the oil price has been declining. In Asia, Brent crude oil fell by nearly $0.5, and during the European session the decrease continued.
The price of Brent crude oil failed to gain a foothold above the psychologically important level 50.00.
With the growth momentum due to disruptions in oil supplies from a number of regions of the world, the price reached nearly 8-month highs near the level 50.45 (Fibonacci level 61.8% of correction to the decrease from June 2015 and the level 65.30 to 2016 lows near the level 27.05 passes near the level 50.70 ). The upper limit of the upward channel also passes here on the daily chart.
Our opinion
The increase to the level 54.00 (EMA144 on the weekly chart and the highs of August, October 2015) may not take place. And from the current levels the price will return to a downward trend.
However, for now that upward dynamics within the channel on the daily chart remains, and the breakdown of the level 50.70 (Fibonacci level 61.8% and November 2015 highs) can form a new range between the levels 50.00 and 54.00.
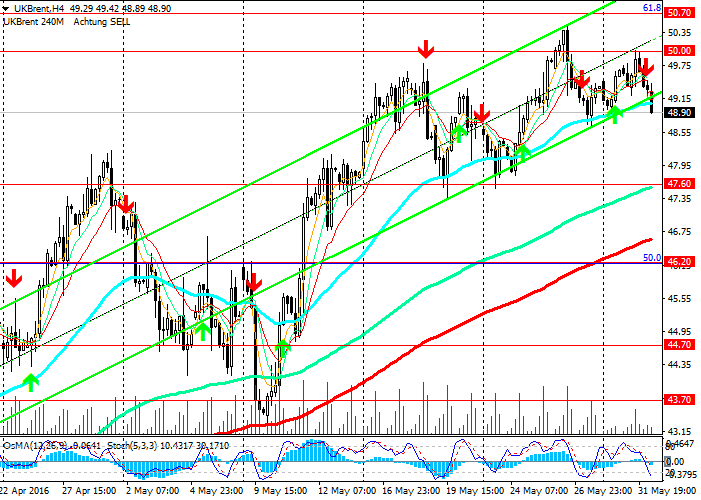
OsMA and Stochastic on the 4-hour and daily charts have come over to the sellers.
In case of breakdown the support level 47.60 (EMA144 on the 4-hour chart and the May lows) a deeper correction is possible to the level 46.20 (Fibonacci level 50% and EMA50 on the weekly chart), and then to support levels 44.70 (EMA200 and the lower limit of the upward channel on the daily chart) and 43.70 (EMA1444). And the consolidation below 41.70 (Fibonacci level 38.2%) can trigger further price decline to the levels 36.05 (Fibonacci level 23.6%) and 30.00.
Support levels: 48.30, 48.00, 47.60, 46.20, 44.70, 43.70, 42.50, 41.70, 41.00, 40.00, 36.05
Resistance Levels: 50.00, 50.70
Trading recommendations
Sell Stop 48.70. Stop-Loss 49.10. Take-Profit 48.30, 48.00, 46.20, 45.00, 44.70, 43.30, 42.50, 41.70, 41.00, 40.00
Buy Stop 49.30. Stop-Loss 48.80. Take-Profit 50.00, 50.70

Within the upward channel

The indicators recommend selling


