

It is a widely used indicator in technical analysis that helps smooth out price action by filtering out the “noise” from random price fluctuations.
A moving average (MA) is a trend-following or lagging indicator because it is based on past prices. The two basic and commonly used MAs are the simple moving average (SMA), which is the simple average of a security over a defined number of time periods, and the exponential moving average (EMA), which gives bigger weight to more recent prices.
The most common applications of MAs are to identify the trend direction and to determine support and resistance levels. While MAs are useful enough on their own, they also form the basis for other indicators such as the Moving Average Convergence Divergence (MACD).
SMA Example
Consider A Security With The Following:Closing Prices Over 15 Days:
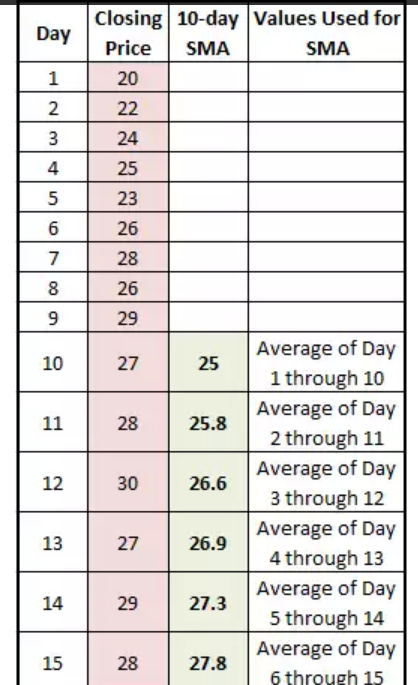
Week 1 (5 days) – 20, 22, 24, 25, 23
Week 2 (5 days) – 26, 28, 26, 29, 27
Week 3 (5 days) – 28, 30, 27, 29, 28
A 10-day MA would average out the closing prices for the first 10 days as the first data point. The next data point would drop the earliest price, add the price on day 11 and take the average, and so on as shown below.
As noted earlier, MAs lag current price action because they are based on past prices; the longer the time period for the MA, the greater the lag. Thus a 200-day MA will have a much greater degree of lag than a 20-day MA because it contains prices for the past 200 days.
The length of the MA to use depends on the trading objectives, with shorter MAs used for short-term trading and longer-term MAs more suited for long-term investors. The 200-day MA is widely followed by investors and traders, with breaks above and below this moving average considered to be important trading signals.
MAs also impart important trading signals on their own, or when two averages cross over. A rising MA indicates that the security is in an uptrend, while a declining MA indicates that it is in a downtrend. Similarly, upward momentum is confirmed with a bullish crossover, which occurs when a short-term MA crosses above a longer-term MA.
Downward momentum is confirmed with a bearish crossover, which occurs when a short-term MA crosses below a longer-term MA.


")
