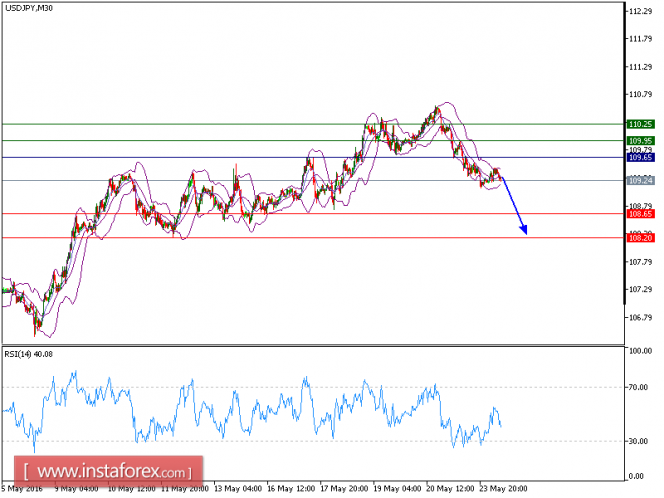
Technical Analysis of USD/JPY for May 24, 2016

USD/JPY is expected to continue its downside movement. Overnight U.S. indexes dipped in light trading volume, dragged by utilities shares. The Dow Jones Industrial Average edged down 8 points to 17492, the S&P 500 declined 4 points to 2048, and the Nasdaq Composite lost 3 points to 4765.
U.S. Federal Reserve officials continued to offer hawkish comments on interest rates on Monday -- this time by San Francisco Federal Reserve President John Williams and St. Louis Federal Reserve President James Bullard. Investors will surely be listening closely a speech to be made by Federal Reserve Chairwoman Janet Yellen on Friday.
Nymex crude oil dropped 0.7% to $48.08 a barrel, gold fell a further 0.3% to $1248 an ounce, and the benchmark 10-year U.S. treasury yield dipped to 1.840% from 1.849% in the previous session.
On the forex front, the U.S. dollar failed to show further upward momentum. The Japanese yen strengthened against the greenback as Japan reported a bigger-than-expected trade surplus in April. Traders also took notes from the U.S. warning Japan against intervening to devaluate the yen at the weekend before G7 meeting of central bankers and finance ministers. USD/JPY slid 0.8% to 109.22.
Meanwhile EUR/USD edged down 6 pips to 1.1216, and GBP/USD declined 0.1% to 1.4482.
On the other hand, the Australian dollar and the New Zealand dollar posted a choppy session, with AUD/USD being broadly flat at 0.7220 (day-high at 0.7259, day-low at 0.7192), and NZD/USD giving up 5 pips to 0.6757 after touching as high as 0.6806. The pair has remained on the downside after breaking below the key support at 109.65 yesterday. It touched a day-low of 109.07 before posting a rebound. Currently the rebound is losing momentum while the pair is trading around the 20-period (30-minute chart) moving average, which stands below the 50-period one. At the same time the relative strength index stays below the neutrality level of 50 lacking upward momentum. The intraday outlook continues to be bearish and the pair should return to the first downside target at 108.65. Below that, the next support would be found at 108.20.
Recommendation : The pair is trading below its pivot point. It is likely to trade in a lower range as long as it remains below the pivot point. Short positions are recommended with the first target at 108.65. A break of this target will move the pair further downwards to 108.20. The pivot point stands at 109.65. In case the price moves in the opposite direction and bounces back from the support level, it will move above its pivot point. It is likely to move further to the upside. According to that scenario, long positions are recommended with the first target at 109.95 and the second target at 110.25.
Resistance levels: 109.95, 110.25, 111
Support levels: 108.65, 108.20. 117.90
The material has been provided by 


