Technical Analysis of USD/JPY for May 19, 2016

USD/JPY is expected to trade with a bullish bias. Overnight US stock indices pared gains to end little changed after the latest minutes of the US Federal Reserve's monetary policy meeting indicated that interest rates could still be raised in June. The Dow Jones Industrial Average and the S&P 500 were broadly flat at 17526 and 2047 respectively, while the Nasdaq Composite was up 0.5% to 4739. Financial shares were the best performers, while utilities came under pressure.
Nymex crude oil declined 0.3% to $48.19 a barrel. Gold dropped 1.7% to $1,258 an ounce, and silver plunged 2.2% to $16.85 an ounce.
US government bonds were sold off after the release of the hawkish Fed minutes, with the benchmark 10-year Treasury yield rising to 1.882% from 1.759% in the previous session. At the same time, the US dollar charged higher, with the Wall Street Journal Dollar Index gaining 0.7% to 87.44.
EUR/USD fell 0.9% to 1.1215, USD/CHF rose 0.8% to a two-month high of 0.9876, while USD/JPY surged 1.0% to 110.18.
Commodities-linked currencies weakened further, with USD/CAD increasing 1.0% to 1.3032, AUD/USD sinking 1.3% to 0.7228, and NZD/USD losing 1.0% to 0.6738.
On the other hand, the British pound was boosted by steady March jobs data in the UK (the jobless rate unchanged at 5.1%) and a poll (Ipsos-Mori) that showed a strong lead by the "In" camp over the "Out" one on Britain's referendum on the European Union's membership. GBP/USD managed to gain 0.9% to 1.4595.
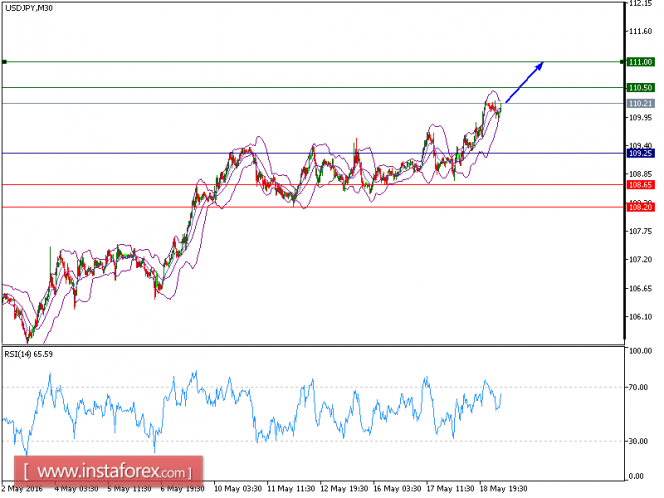
The pair did emerge on the upside upon completing a consolidation yesterday. Having broken above both resistances at 109.20 and 109.65, it reached a high of 110.25 while forming a bullish trading channel. Currently, it is supported by the ascending 20-period (30-minute chart) moving average, which stands above the 50-period one. The immediate resistance at 110.50 is in sight, and the next one would be found at 111.00 (a key support seen on April 27).
Trading Recommendation:
The pair is trading above its pivot point. It is likely to trade in a wider range as long as it remains above its pivot point. Therefore, long positions are recommended with the first target at 110.50 and the second one, at 111. In the alternative scenario, short positions are recommended with the first target at 108.65 if the price moves below its pivot points. A break of this target is likely to push the pair further downwards, and one may expect the second target at 108.20. The pivot point is at 108.65.
Resistance levels: 110.50, 111, 11.45
Support levels: 108.65, 108.20, 107.40


