Technical Analysis of GBP/NZD for April 12, 2016
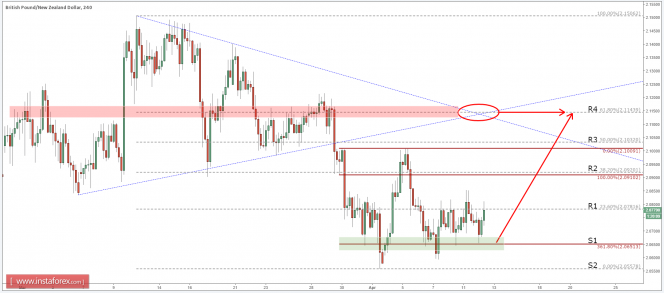
After the breakout of the uptrend trend line, the price dropped substantially and the pair found the support at 0% (S2) Fibonacci level applied to the trend line's breakout point. At the same time, a strong support is formed at the 361.8% (S1) Fibs applied to the first corrective wave after the trend line's breakout.
All in all, the price does not look like moving lower the strong support area between 2.0550 and 2.0650, which could lead to a correctional move up.
Consider buying GBP/NZD on small pullbacks towards S1 (2.0650) targeting one of the resistance levels with the R4 (2.1140) area being the final target. Ideally the stop loss should be just below S2 (2.0550) but with more aggressive trading it could be also placed below S1 (2.0650).
Support: 2.0550, 2.0650
Resistance: 2.0780, 2.0920, 2.1030, 2.1140

The material has been provided by InstaForex Company - www.instaforex.com


