Gold Technical Analysis for March 23, 2016
Despite an early breakout above the short-term resistance in Gold price, sellers pushed prices below support canceling the bullish scenario for a new high towards $1,300. As we said in our previous analysis, a rise from $1,045 can be completed. So we must focus on the bigger picture.

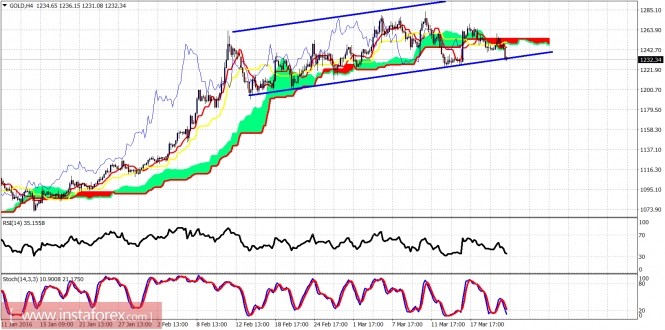
Blue lines - sideways channel
Gold has made a new lower low after a lower high yesterday. It has also broken below the Kumo (cloud) on the 4 hour chart. Price is now testing the lower channel boundary. The entire rise from $1,045 is most probably over, so we should expect to see a pull back towards $1,150-$1,190.

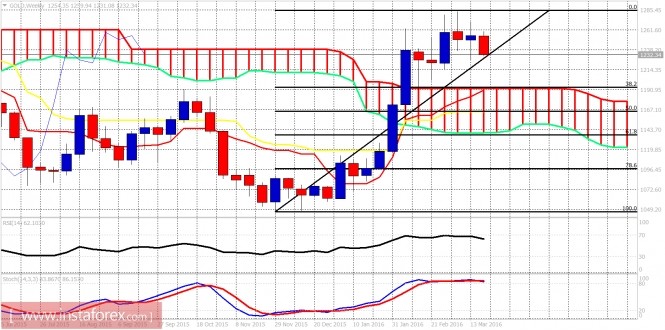
On a weekly basis, price shows signs of a bearish reversal. The first target is the 38% Fibonacci retracement and the upper Kumo (cloud) boundary. The pull back in Gold price could even reach $1,100-$1,150. So this will be an important buy area for our longer-term bullish reversal scenario.
The material has been provided by InstaForex Company - www.instaforex.com


