Gold Analysis for March 07, 2016
Overview :
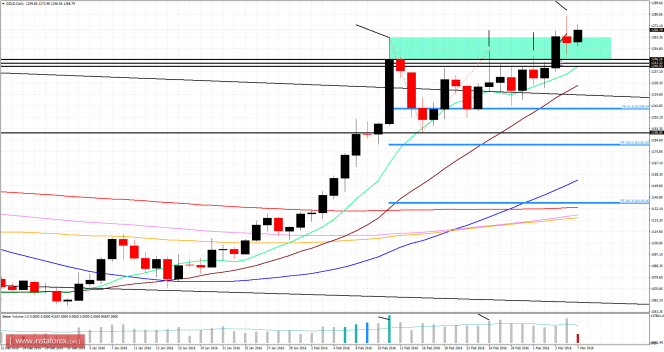
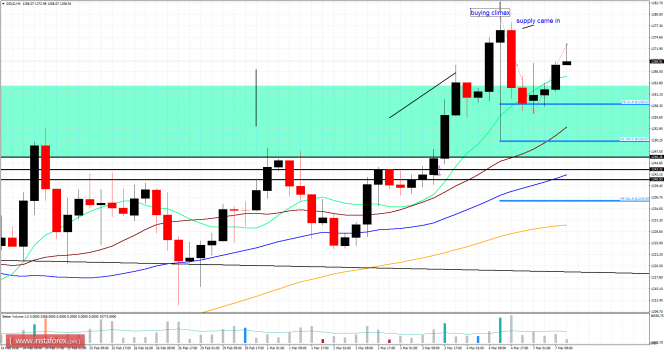
Since our last analysis, gold has been trading upwards. As I expected, the price tested the level of $1,279.67. Anyway, in the daily time frame, I found a a supply bar (up thrust), which is a sign of weakness. Intraday buying at this stage looks risky. According to the the 4H time frame, I found a massive volume spike with very wide spread of the bar (buying climax, which is a strong sign of weakness). Intraday downward stations are set at the price of $1,258.00 and $1,250.00.


Daily Fibonacci pivot points:
Resistance levels:
R1: 1,267.00
R2: 1,274.00
R3: 1,285.00
Support levels:
S1: 1,244.20
S2: 1,237.10
S3: 1,225.50
Trading recommendations for today: Be careful when buying gold at this stage and watch for potential intraday selling opportunities.
The material has been provided by InstaForex Company - www.instaforex.com


