

The Dark Force Of The Market

This indicator reads candles and detects imbalances in the struggle between bullish and bearish forces. Allowing us to watch this force influencing each sail and power that has that force.
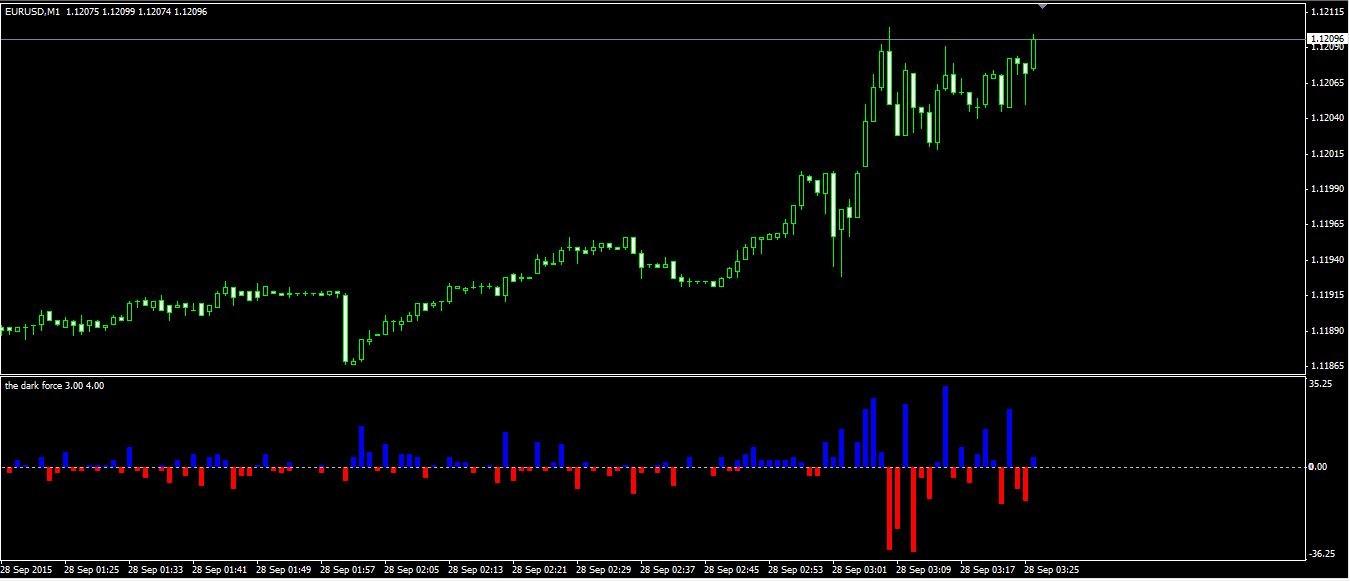
In the chart we see a histogram, blue (for the upward force and red to the bearish candle). If the histogram is blue, in this candle the battle for the market has won the upside. If the histogram is red, that candle in the battle for the market has won the downside. In addition the height of the histogram informs us of the power with which he has won that battle.
Thus we find bars and bar groups with power to make our tickets for the dark forces of the market.
That is if we have a histogram in red with much greater value than previous, we will think that the market is a drop or stopping or starting an upward movement.
If we have a blue bar with a much higher than the previous value, we will think that the market is a rise or stopping or starting a downward movement
Importantly, this indicator does not read inputs but the market and gives us information for our decisions so although you can automate and systematize Trading system, born and Trading for manual focus, being a tool that helps us in decision-making and not a trigger that causes us to enter the market.
Below we explain some useful examples of the indicator, so that we have more clear concepts use.
First we will analyze the market as a drop stopped and started a bullish move.

In the graph we can see how we have a large bearish candle, which is accompanied by a victory of the bearish forces but with very goose power for large displacement experienced by the price in the following candles upward forces strike back and enter the market with a great power, marking the start of the upward movement we see in the image.
He is trying to make a bearish break, without sufficient strength, they are defeated or the bulls take over the market.
As we see the indicator data tell us we would not get otherwise. Then provides an extremely useful information for our trade.
Now in the same graph we will analyze the end of the trend.

After the start of the trend analyzed in the previous graph, the price runs up with various skirmishes, until a time when a great power without bullish price movement occurs, if we look better analyze this area as there is a large bearish candle which is not won by the bears, this data gives us information that shortly bullish increased power will give us one last push to the trend. If you look at the enlargement of the left, we see how the bears take control of the market with great power, with a high-power and mixed signs, it informs us of the great battle of the market at that point and therefore exhaustion trend waiting for one of the two sides re-take control.
Again, the indicator gives us useful information that can not be obtained directly from the graph.
Let's analyze a third sequence.

We will analyze the following sequence because it is very interesting. Start with a winning battle bears and initiating a downward trend, after which observe predominance area of bulls and bears predominance area that would result in the consolidation trend for us.
After this battle zone bulls win the battle clearly producing a clear upward trend, moving to a new area of consolidation in which victories and to a predominance of bears is detected.
These victories are clearly defined and starts a descenderte which is first offset by bears and then clearly defined movement.
It is certainly a very illustrative zone power indicator, and for those who want to deepen the recommend analyze the square of the upper graph as there are early signs of the beginning of the uptrend unable to bears keep their Bear Power.
Let's look at another example of a downtrend

I hope these examples have been clear about the usefulness of the indicator.
Greetings Raul


")
![[XAUUSD]: Weekly Liquidity Activation Points (timings), June 22-26, 2026](https://c.mql5.com/6/1013/splash-preview-771790.png "[XAUUSD]: Weekly Liquidity Activation Points (timings), June 22-26, 2026")
")