
Crude Oil Price Action Analysis - descending triangle pattern was broken for more bearish
12 November 2015, 06:11

0
1 015
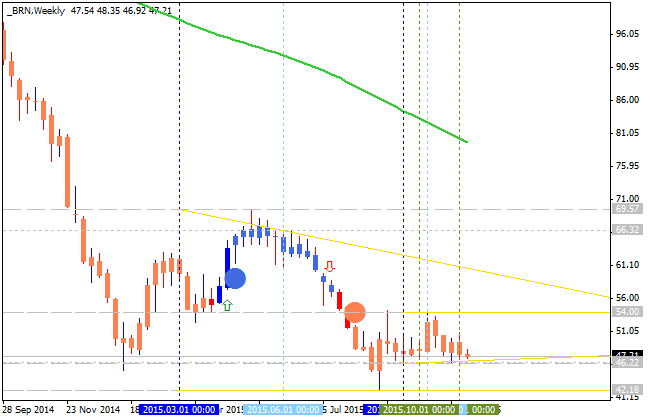
W1 price is located below 200 period SMA and 100 period SMA for the primary bearish with secondary ranging between 46.22 support level and 54.00 resistance level:
- descending triangle pattern was broken by the price for the bearish trend to be continuing;
- if the price breaks 46.22 support level from above to below so we may see 42.18 as the next real bearish target;
- bullish reversal target is 69.57 - if the price breaks this level from below to above so the bullish reversal will be started.
If the price will break 46.22 support level so the primary bearish condition will be continuing up to 42.18 as the next real bearish target.
If the price will break 42.18 support level so we may see the bearish breakdown.
If the price will break 69.57 resistance level from below to above so the reversal of the price movement from the primary bearish to the primary bullish market condition may be started.
If not so the price will be ranging within the levels.
| Resistance | Support |
|---|---|
| 66.32 | 46.22 |
| 69.57 | 42.18 |
Trend:


 Trading Guide")

