 Price Action Analysis - symmetric triangle pattern to be crossed for direction")
GOLD (XAU/USD) Price Action Analysis - symmetric triangle pattern to be crossed for direction
5 November 2015, 12:11

0
1 607
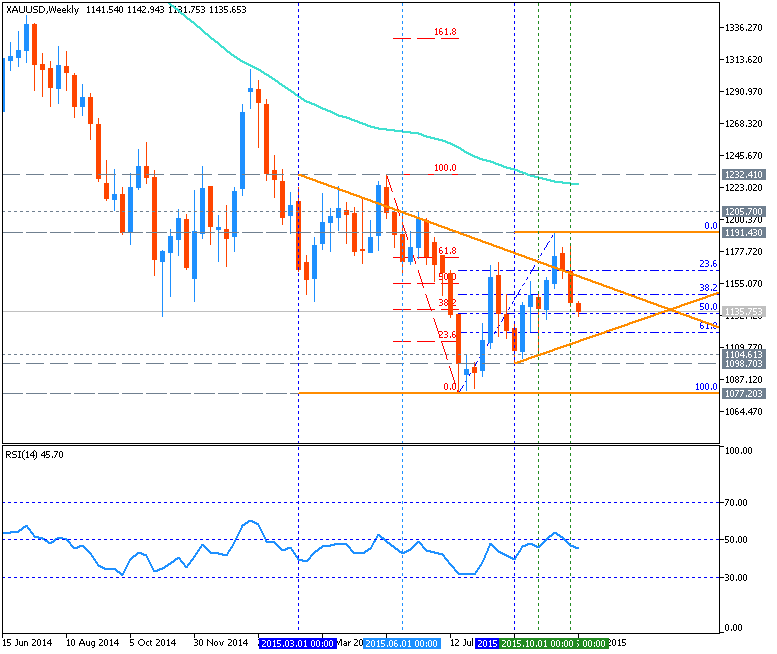
W1 price is located below 200 period SMA and below 100 period SMA for the primary bearish with secondary ranging between Fibo resistance level at 1191.43 and Fibo support level at 1077.20:
- Symmetric triangle pattern was formed by the price to be crossed for direction.
- If the price breaks 1191.43 Fibo resistance level so we may see the secondary rally within the primary bearish market condition.
- If the price breaks 1232.41 resistance level so the price will be started to be reversed from the primary bearish to the primary bullish condition.
- if the price breaks 1077.20 support level so the primary bearish trend will be continuing.
Trend:
- W1 - ranging bearish


")

![[XAUUSD]: Weekly Liquidity Activation Points (timings), June 22-26, 2026](https://c.mql5.com/6/1013/splash-preview-771790.png "[XAUUSD]: Weekly Liquidity Activation Points (timings), June 22-26, 2026")