Trading system for buying gold (XAUUSD) and Oil | Download a ready-made EA

Trading assets with a strong trend component are of enormous interest to a trader. Such assets produce prolonged trends and are also automatically adjusted for inflation.
I have been working with XAUUSD for quite a long time and have achieved some success with this symbol. In this post I want to share one of the highly effective patterns for buying gold and oil. The system is based on price action and the universal moving average crossover indicator "Moving Average Cross Signal". The Expert Advisor can be downloaded completely free of charge. Your feedback and opinions on this trading system are very important. Write to me in private messages or in the comments to the indicator.
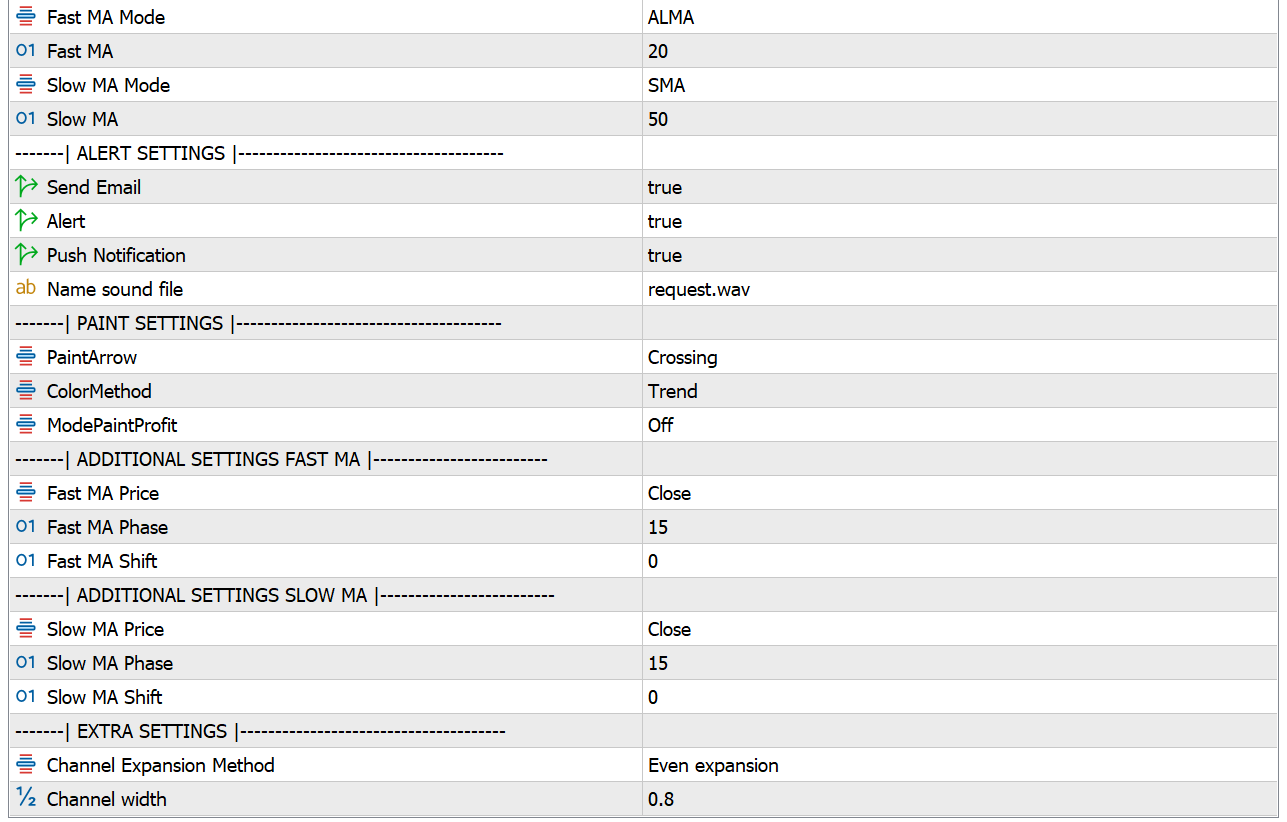
For the EA to work, you need to download the free indicator "Moving Average Cross Signal" from the MQL5 Market and leave it where it is. The indicator file must stay in the "Indicators/Market" folder.
The EA is set up to work on Gold (XAUUSD) on the H1 (1 hour) timeframe. However, you can use it on any symbols and timeframes by selecting the parameters yourself.
Now that we have everything we need, let's move on to the description of the entry pattern and the trading system as a whole.
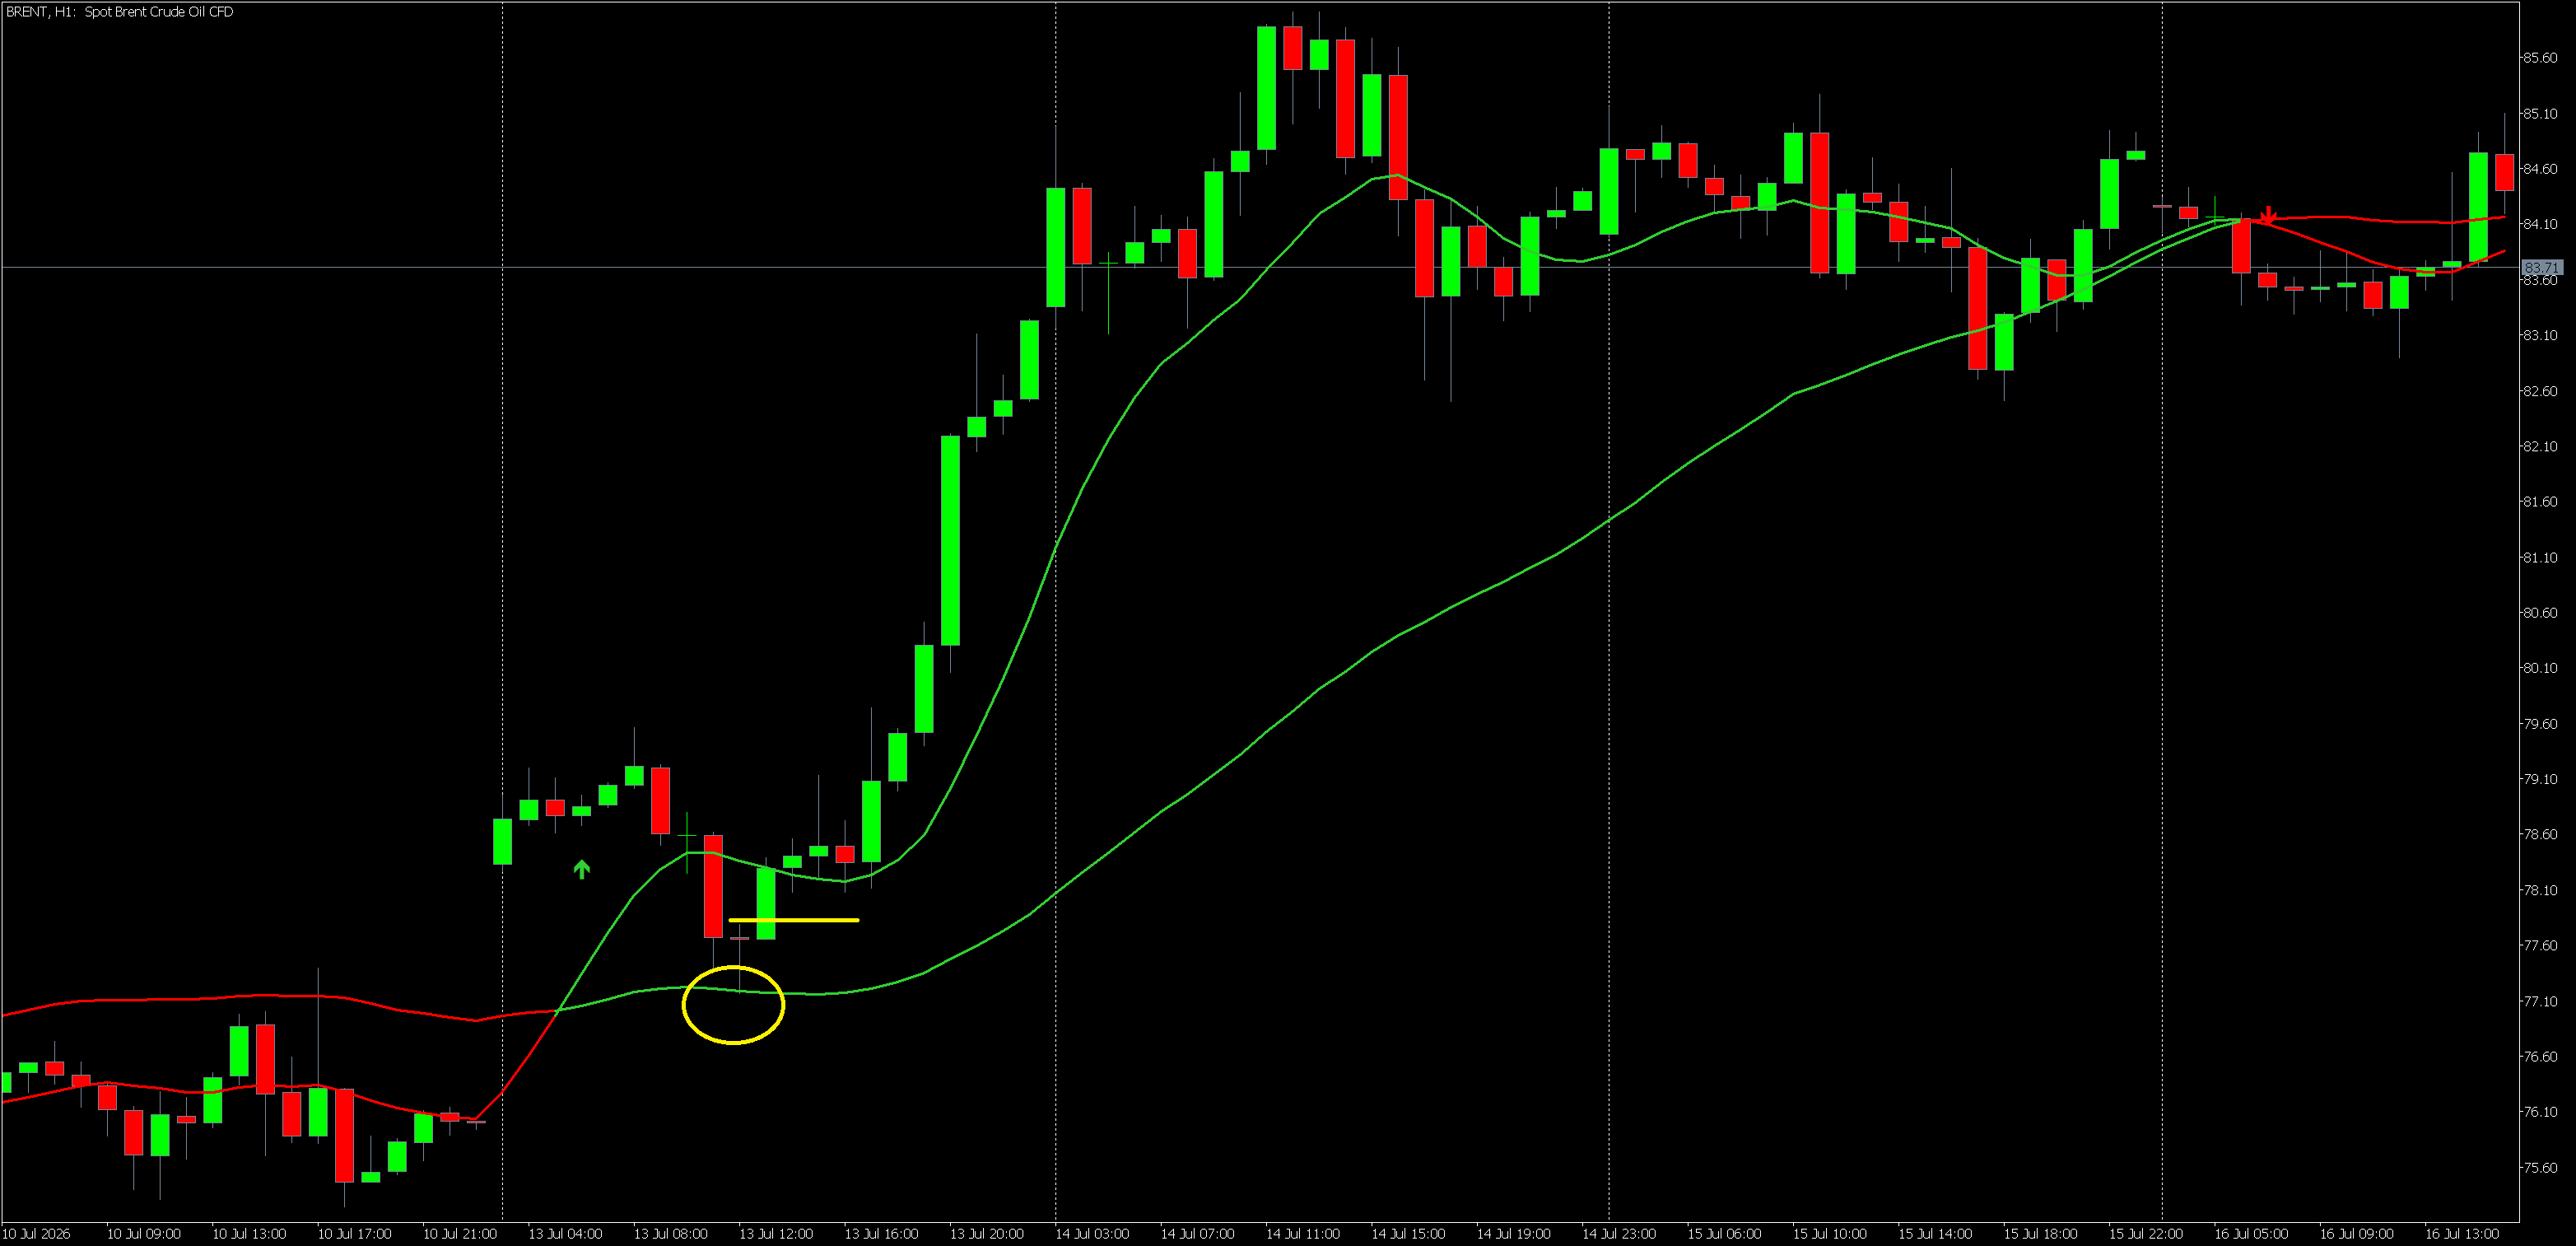
Pattern: Piercing the Moving Average
- The indicator must be showing an uptrend.
- The bar's open and close must be above the slow moving average (or, to be more precise, the indicator's second line).
- The bar's low must be below that moving average.
- Entry confirmation — a breakout of the bar's high.
Let's look at the pattern using an oil chart as an example. It works great there too!
The Trading System
Once the pattern appears, we place a pending BUY STOP order at the high of the bar that formed the signal. To exit the position we will use STOP LOSS, TAKE PROFIT and TRAILING STOP. Pending orders are kept for just 1 bar (1 hour in our case). While a position is open, no new positions are opened.
The Stop Loss is placed at the low of the pattern. The Take Profit is a multiple of the Stop Loss. The Trailing Stop is set as a percentage of price.
- BUY_TPxSL = 5;
- BUY_TrailingStop = -2.0;
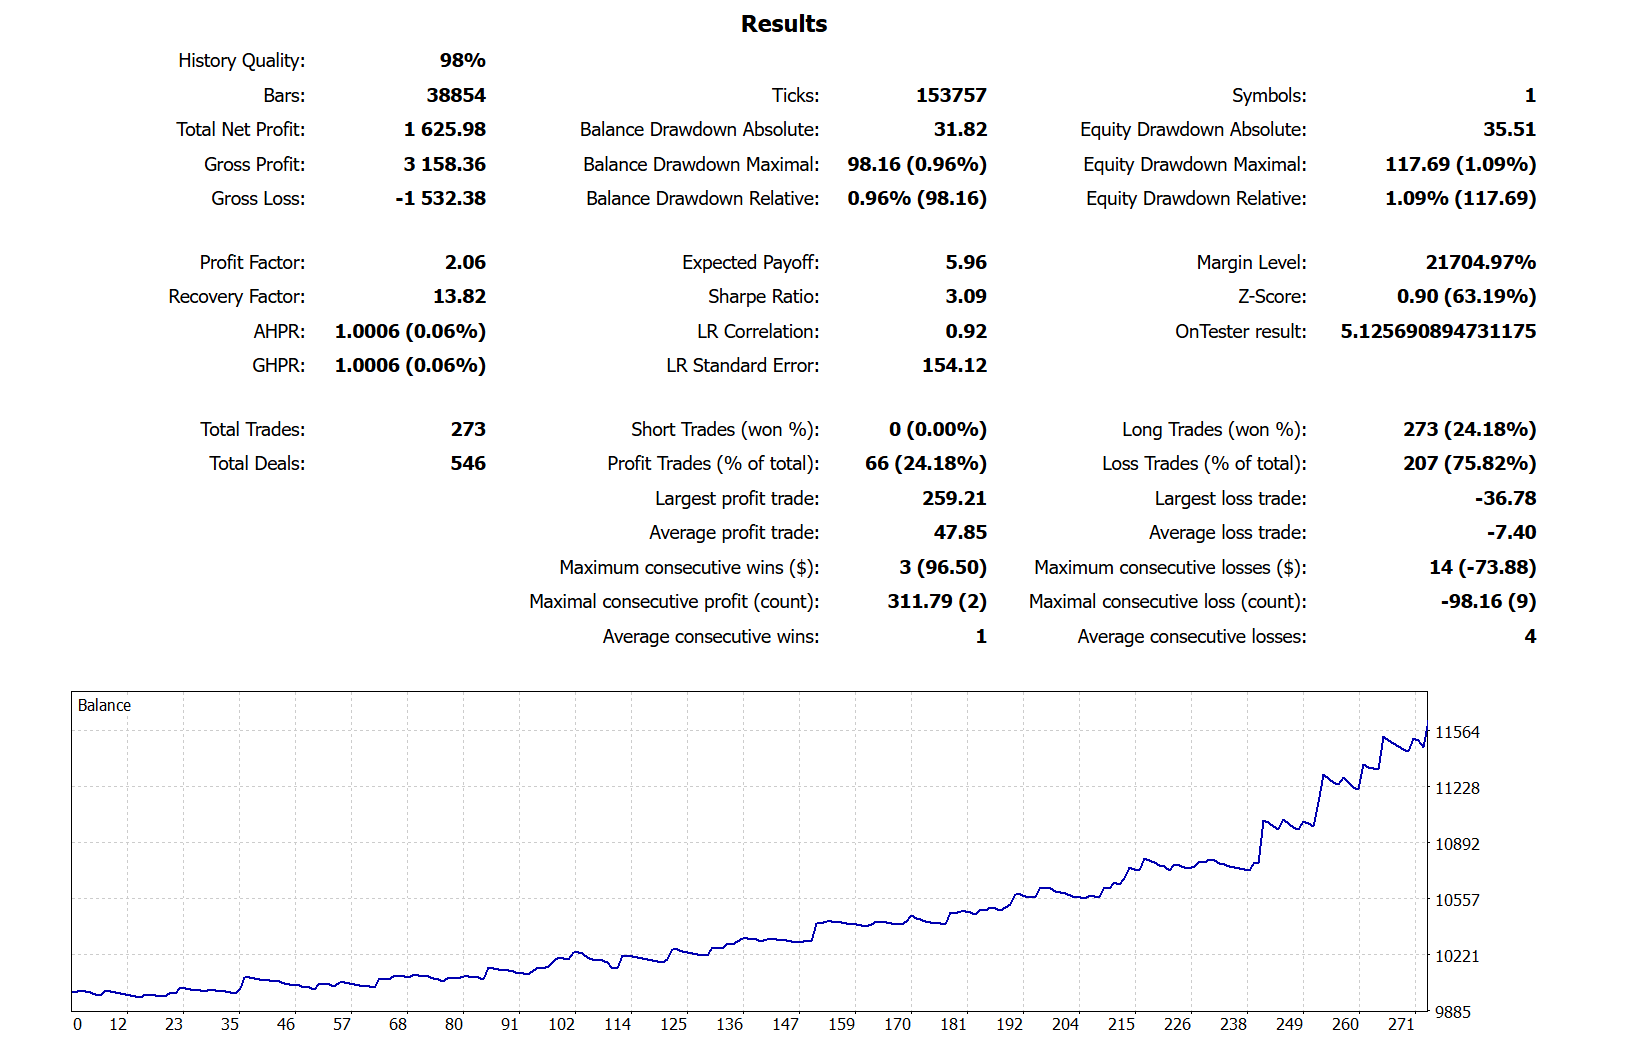
XAUUSD, H1. Performance of this system over the 2020-2025 period using a fixed lot.
Conclusions
1. A classic trend-following profile. The system wins only 24% of the time, but the ratio of average profit to average loss is 6.5 : 1. With such a payoff, the breakeven point sits at a 13.4% win rate — the actual win rate therefore provides almost a twofold safety margin. An expected payoff of 5.96 against an average loss of 7.40 works out to +0.8R per trade, which is a decent result for a system with no filters and no entry optimization.
2. The risk profile is the main advantage. Over six years the balance drawdown never exceeded 1% of the deposit, and the equity drawdown stayed at 1.09%. The difference between them is minimal: the tight stop at the low of the pattern does not let the position "breathe" into the red. The profit-to-maximum-drawdown ratio is 16.6, and the recovery factor is 13.82.
This leads to a practical conclusion: with a fixed lot the system is underloaded in terms of risk. The absolute return of ~2.5% per year looks modest precisely because the risk per trade is a fraction of a percent. Increasing the volume proportionally (or switching to lot sizing based on a percentage of the deposit) scales both the profit and the drawdown almost linearly. That said, the historical drawdown is a lower-bound estimate: in live trading, allow for a 2-3x margin.
3. Stability is confirmed by the statistics. The correlation of the balance curve with the linear regression is 0.92 — the growth is uniform, with no dependence on a single lucky period. The Z-Score of 0.90 (63.19%) is well below the 95% significance threshold, meaning that there is no dependence between consecutive trades — winning and losing streaks are distributed randomly. This implies that filters of the "skip the signal after N losses" type are pointless, and that martingale is contraindicated.
4. Losing streaks are the norm, not a failure. The longest streak was 14 consecutive losing trades (-73.88, i.e. 0.74% of the deposit), and the average streak is 4. For a distribution with a 24% win rate over a sample of 273 trades, the expected length of the longest streak is right around 15, so the observed result fits the statistics perfectly. This is the system's main psychological barrier: not everyone will be able to trade it manually, and that is exactly why it is implemented as an Expert Advisor.
5. Buys only — and that is deliberate. All 273 trades are long. The pattern exploits a structural property of the asset: gold and oil carry a built-in inflation component and rise for longer than they fall. A mirrored SELL pattern (piercing the moving average from above) does exist, but on such assets it is statistically weaker — upward moves are prolonged, while downward ones are impulsive and short.
6. The signal is rare. 273 trades over six years is roughly 45 per year; fewer than 1% of bars produce an entry. The pattern is not intended for "active" trading. The logical next step is a portfolio of several trending symbols (XAUUSD, BRENT, XAGUSD, indices) and several timeframes on a single account: the signals are weakly correlated in time, while the total load on the deposit remains low. The oil chart at the beginning of the article is direct confirmation that the pattern transfers.
Limitations Worth Stating Honestly
- The test period was favourable. 2020-2025 was a sustained bull market in gold. A long-only system on a rising asset gets a tailwind. Testing on the sideways and bearish phase of 2012-2015 is a must.
- The contribution of large trades. The largest winning trade (259.21) accounts for almost 16% of the entire net profit. This is normal for trend-following logic, but it means the distribution of results has a "fat tail": missing a few of the best signals will noticeably degrade the statistics.
- Costs. The test was run at 98% history quality. Entering with a pending BUY STOP on a break of the high is a zone of increased slippage, especially on gold at the moment of news releases. Your broker's real spread and commission are capable of cutting into part of the expected payoff, so run the test with your own trading conditions before going live.
- The parameters were not curve-fitted. TP = 5xSL and the -2% trailing stop were chosen from general reasoning rather than optimized. That is a plus in terms of robustness, but also an indication that the potential for improvement has not been exhausted.
What's Next
The nearest directions for further work: moving from a fixed lot to risk as a percentage of the deposit, adding a volatility filter (ATR) to cut off pierces that occur inside a flat, testing the mirrored SELL pattern, and assembling a portfolio of trending symbols.
The EA is published free of charge and without restrictions — test it on your own symbols and conditions. Please share your results, remarks and ideas for improving the system in the comments to the indicator or in private messages.
Indicator Parameters for Oil