

Occam's razor says the S&P 500 dropped its long-term uptrend in late August, meaning it is now in a downtrend.
As MarketWatch reporter Tomi Kilgore explains, Occam’s razor is the philosophical principle that suggests all things being equal, the simplest explanation is likely to be the right one.
“The trend is
your friend” is a famous Wall Street principle. This is what all technical patterns and economic data are used for - to decide which direction the longer-term trend is taking and if it is about to shift.
Once the trend is determined, the one hundred year-old Dow Theory
of market analysis says it is assumed to be maintained until it throws signals that it changed the direction, according to the Market
Technicians Associations knowledge base.
To put it differently, the trend is your friend, until it isn’t.
A trendline is potentially the best chart pattern to determine the trend,
as it is also the simplest. The broken trendline is the most vivid example of if a trend has reversed.
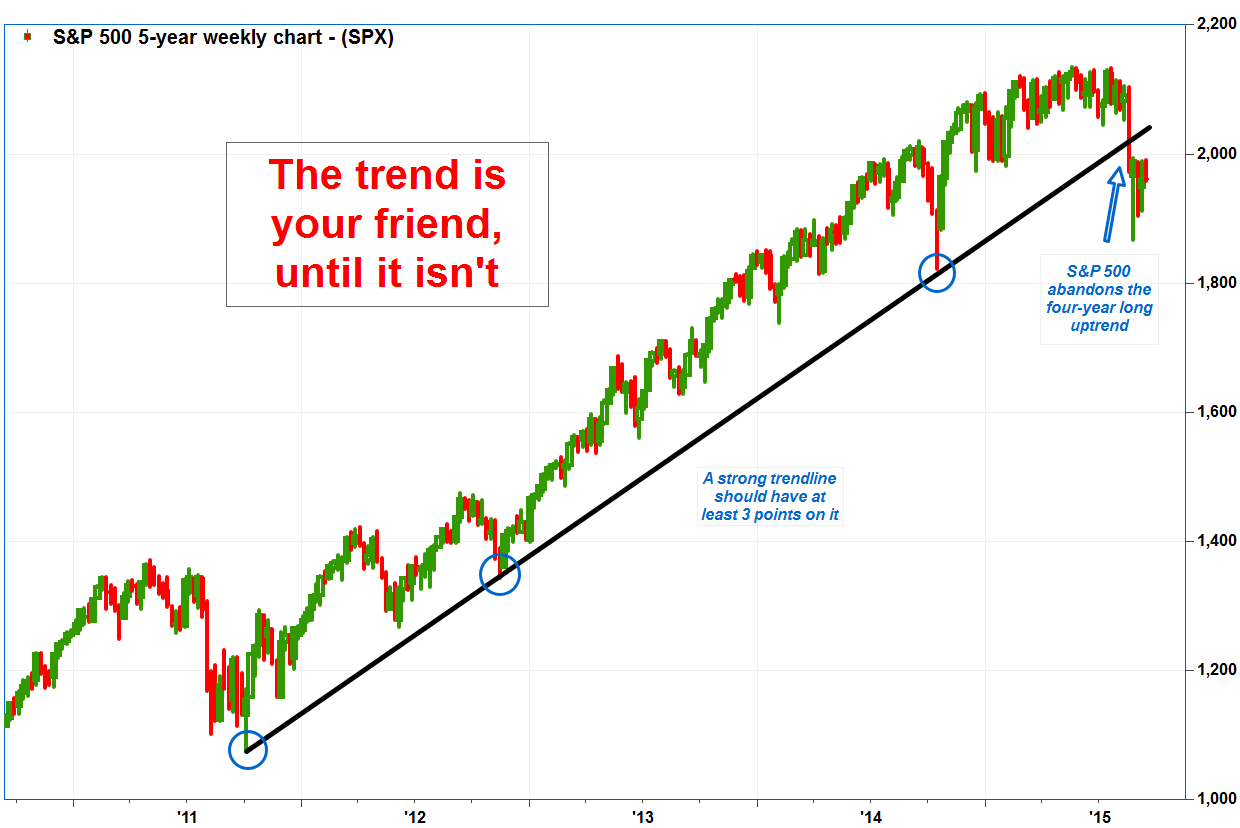
The S&P 500 had been riding a strong weekly uptrend, defined by the trendline connecting the bottom of the last correction in October 2011 with the bottom of the November 2012 pullback and the October 2014 low. The S&P 500 fell below that line in late August, meaning the uptrend flipped to a downtrend.
The Occam’s razor principle now says that the uptrend which investors enjoyed for four years, is now gone.


")
