
Quick Technical Overview - NIKKEI 225 Index: R2 yearly Pivot to be broken for breakout
6 August 2015, 09:11

1
612
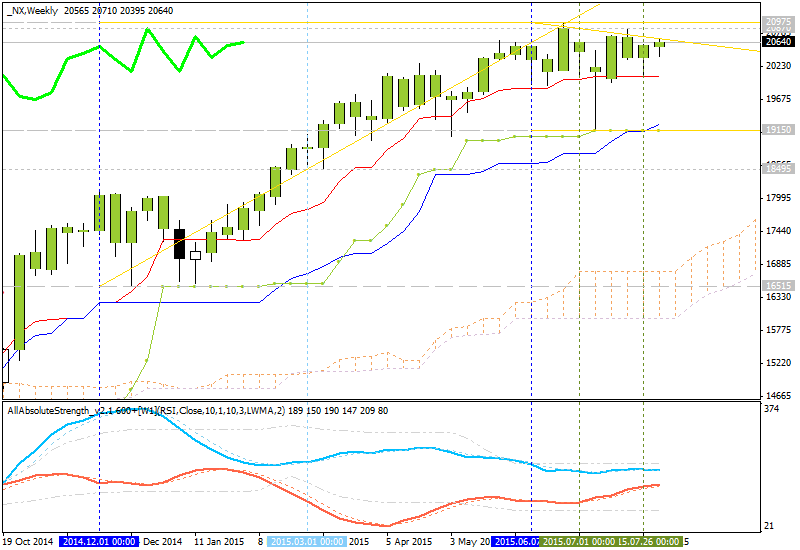
Weekly price is on bullish market condition for ranging between 19150 support level and 20975 resistance level. The price is breaking R2 Pivot at 20733 for the 20975 as the next target.
- Chinkou Span line is located to be above the price and indicating the bullish trend to be continuing.
- 'Reversal' Senkou Span A line (which is the virtual border between the primary bullish and the primary bearish on the chart) is located far below the price which makes bearish reversal to be impossible in the near future.
- The nearest resistance level is 20733, and the next level is 20975.
- Absolute Strength indicator is estimating the secondary ranging.
- Pivot Points (yearly PP on weekly chart): the price is ranging between R1 Pivot at 19117 and R2 Pivot at 20733.
| Instrument | S1 Pivot | Yearly PP | R1 Pivot | R2 Pivot |
|---|---|---|---|---|
| NX |
14867 |
16483 |
19117 | 20733 |
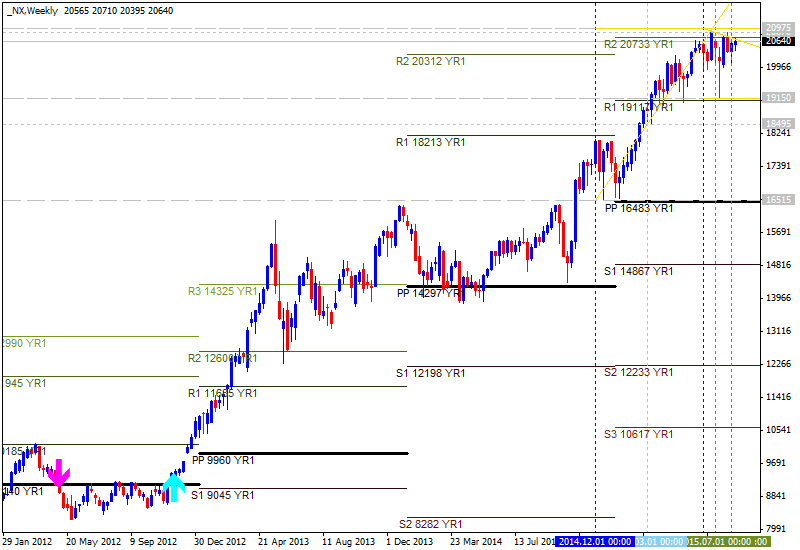
If W1 price will break R2 Pivot resistance level at 20733 on close W1 bar so the primary bullish trend will be continuing with the secondary ranging market condition.
If W1 price will break 20975
resistance level so the bullish trend will be
continuing with good breakout possibilities in the near future.
If not so the price will be ranging between the levels.
Trend:


