
Technical Analysis for US Dollar, S&P 500, Gold and Crude Oil - prices is trending below the $1200/oz figure for gold
17 June 2015, 15:11

2
244
US DOLLAR TECHNICAL ANALYSIS – Prices paused to digest losses
after sliding to the weakest level in three weeks. Near-term support is
at 11834-9 area (May 20 close, 50% Fibonacci retracement), with a break
below that on a daily closing basis exposing the 61.8% level at 11790.
S&P 500 TECHNICAL ANALYSIS – Prices pulled back to test rising trend line support set from late-March lows once again, a barrier reinforced by the 61.8% Fibonacci retracement at 2077.20. A break below that targets the 76.4% level at 2063.00.
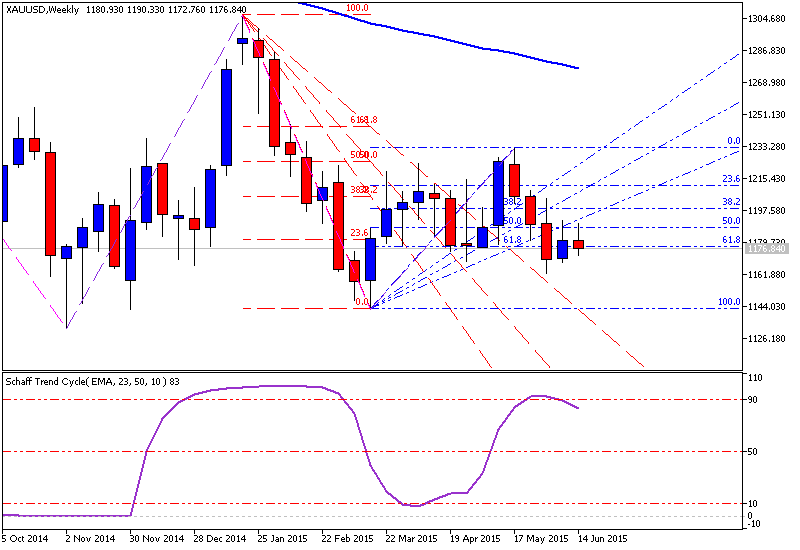
GOLD TECHNICAL ANALYSIS – Prices continue to tread water below
the $1200/oz figure. A break above the June 10 high at 1192.23 exposes
the 50% Fibonacci retracement at 1197.47.


")
