
Technical Analysis for US Dollar, S&P 500, Gold and Crude Oil - Stalls at 69.57 Monthly Resistance for Oil

US DOLLAR TECHNICAL ANALYSIS
Prices resumed its advance, touching the highest level in six weeks.
Near-term resistance is at 12037, the 76.4% Fibonacci retracement, with a
break above that on a daily closing basis exposing the March 13 high at
12149.
S&P 500 TECHNICAL ANALYSIS
Prices are in consolidation mode having set a record high last week. A
break below the 2100.00-6.50 area (trend line, 38.2% Fibonacci
retracement) exposes the 50% level at 2099.60.
GOLD TECHNICAL ANALYSIS
Prices are digesting losses after claiming a foothold below the $1200/oz
figure anew. A close below range support at 1178.09 exposes the 38.2%
Fibonacci expansion at 1169.31. Alternatively, a rebound above the 23.6%
level at 1193.38 targets trend line support-turned-resistance at
1203.60.
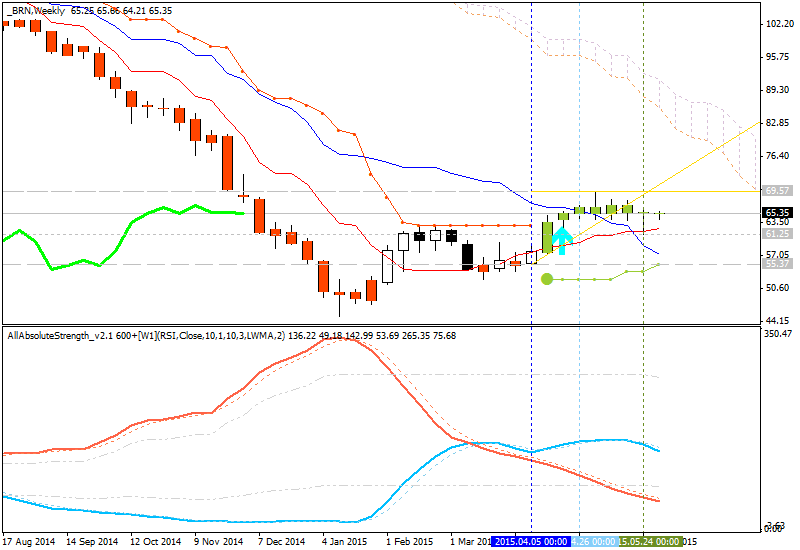
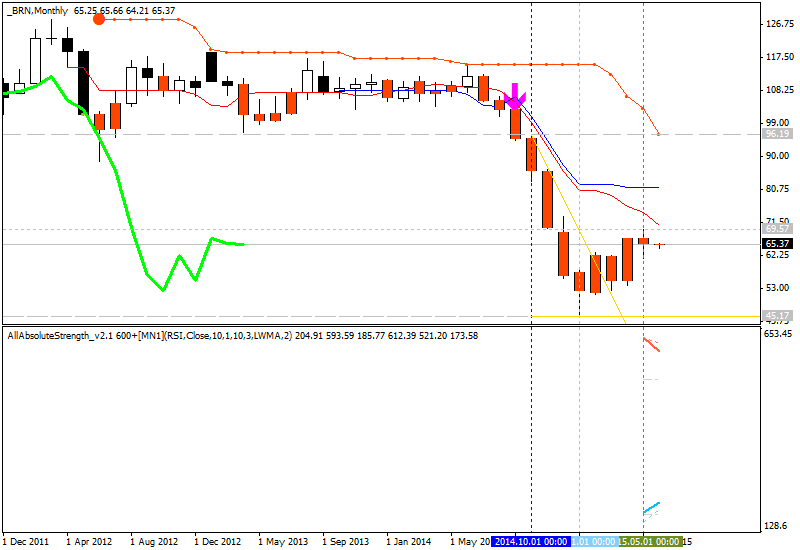
CRUDE OIL TECHNICAL ANALYSIS
Prices rebounded from support guiding the up move from lows set in mid-January. A push above downward-sloping resistance at 65.92 exposes the May 6 high at 69.60, followed by the 38.2% Fibonacci expansion at 70.57. Alternatively, a move below trend line support at 61.66 targets the 38.2% Fib retracement at 60.27.


")
")