
Technical Pattern Analysis for US Dollar, S&P 500, Gold and Crude Oil - Near-term resistance for Gold is at 1232.30, the May 18 high.

US DOLLAR TECHNICAL ANALYSIS
Prices may be preparing to turn
lower anew following the formation of a Bearish Engulfing candlestick
pattern. A daily close below the 14.6% Fibonacci expansion at 11773
exposes the 23.6% level at 11725.
S&P 500 TECHNICAL ANALYSIS
Prices are consolidating after
breaking range resistance and setting a new record high. From here, a
daily close above the 50% Fibonacci expansion at 2140.70 exposes the
61.8% level at 2159.30.
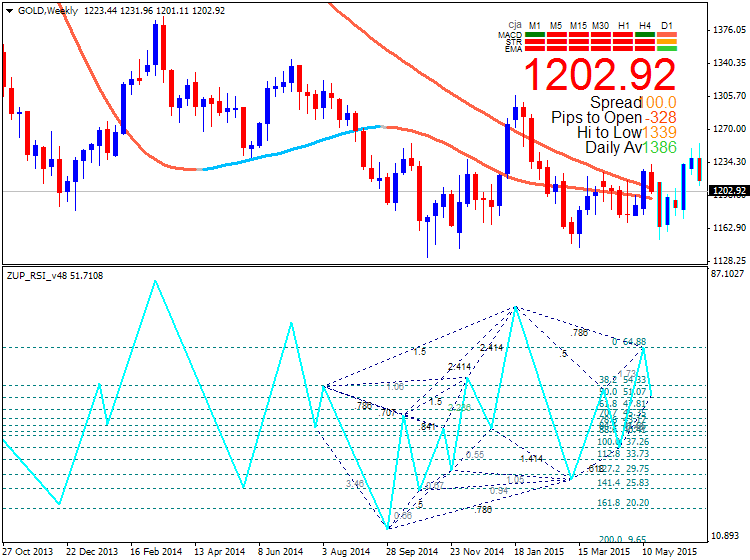
GOLD TECHNICAL ANALYSIS
Prices are consolidating after issuing
the largest daily decline in three weeks. A close below trend line
resistance-turned-support at 1205.90 exposes the 23.6% Fibonacci
expansion at 1193.38. Near-term resistance is at 1232.30, the May 18
high.
CRUDE OIL TECHNICAL ANALYSIS
Prices remain locked in a choppy
consolidation range below the $70/barrel figure. A daily close below the
23.6% Fibonacci retracement exposes the 38.2% level at 60.27.
Alternatively, a move above trend line resistance at 67.69 targets the
23.6% Fib expansion at 69.70.


 Trading Guide")

")