Technical Analysis for US Dollar, S&P 500, Gold and Crude Oil: negative RSI divergence for crude oil price and S&P 500 to turn lower

US DOLLAR TECHNICAL ANALYSIS
Prices declined for a sixth
consecutive day, dropping to the weakest level in nearly three months.
Near-term support is at 11754, the 123.6% Fibonacci expansion, with a
break below that on a daily closing basis exposing the 138.2% level at
11719.
S&P 500 TECHNICAL ANALYSIS
Prices declined as expected
after putting in a Bearish Engulfing candlestick pattern, hinting a
double top is forming at 2119.40 (February 25 high). Negative RSI
divergence bolsters the case for a downside scenario. A break below the
38.2% Fibonacci retracement at 2093.50 exposes the 50% level at 2083.50.
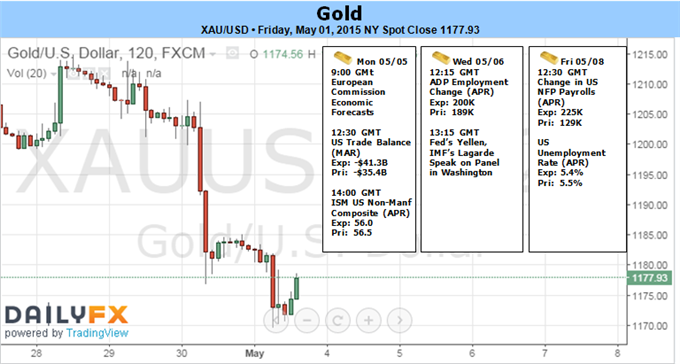
GOLD TECHNICAL ANALYSIS
Prices are attempting to build upward
anew after reclaiming a foothold above the $1200/oz figure. A break
above the April 28 high at 1215.00 exposes the April 6 top at 1224.15.
Alternatively, a turn below falling channel top
resistance-turned-support at 1197.38 targets the March 31 low at
1178.38.
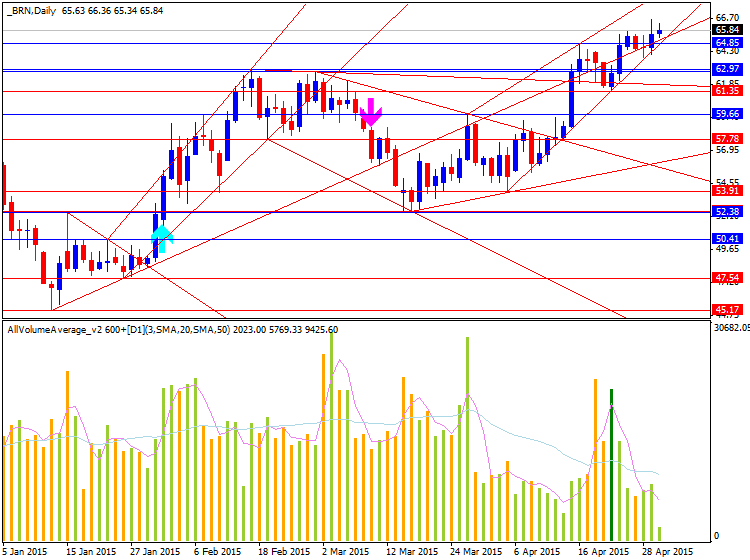
CRUDE OIL TECHNICAL ANALYSIS
Negative RSI divergence hints
prices may be readying to turn lower anew. A break below the 14.6%
Fibonacci retracement at 63.53 exposes the 23.6% level at 61.60.
Alternatively, a move above the 76.4% Fib expansion at 66.16 targets the
100% threshold at 70.36.