

0
1 510
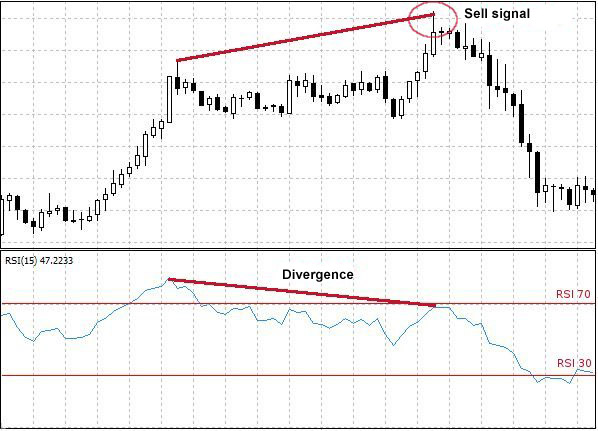
Wilder suggests that divergence between an asset's price movement
and the RSI oscillator can signal a potential reversal. The reasoning is
that in these instances, directional momentum does not confirm price.
A bullish divergence forms when the underlying asset makes a lower low and RSI makes a higher low. RSI diverges from the bearish price action in that it shows strengthening momentum, indicating a potential upward reversal in price.
A bearish divergence forms when the underlying asset makes a higher high and RSI forms a lower high. RSI diverges from the bullish price action in that it shows weakening momentum, indicating a potential downward reversal in price.
As with overbought and oversold levels, divergences are more likely to give false signals in the context of a strong trend.
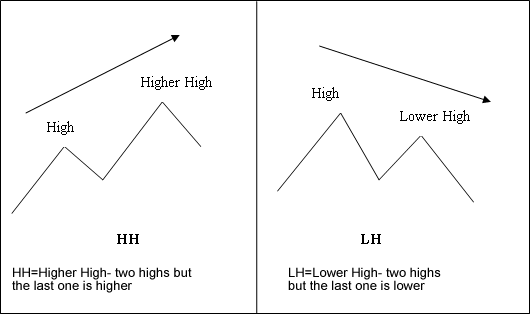
How to spot divergence
In order to spot divergence we look for the following:
- HH=Higher High - two highs but the last one is higher
- LH= Lower High - two highs but the last one is lower
- HL=Higher Low - two lows but the last one is higher
- LL= Lower Low - two lows but the last one is lower
First let us look at the illustrations of these terms
There are two types of divergence:
- Classic
- Hidden


")
")
![[XAUUSD]: Weekly Liquidity Activation Points (timings), June 22-26, 2026](https://c.mql5.com/6/1013/splash-preview-771790.png "[XAUUSD]: Weekly Liquidity Activation Points (timings), June 22-26, 2026")