
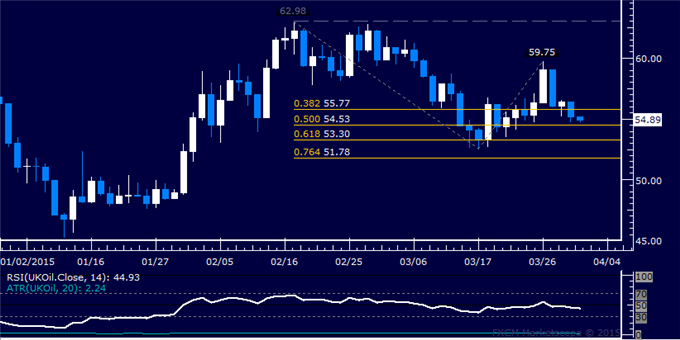
Technical Pattern Analysis for US Dollar, S&P 500, Gold and Crude Oil - prices reversed sharply lower after finding resistance below the $60/barrel

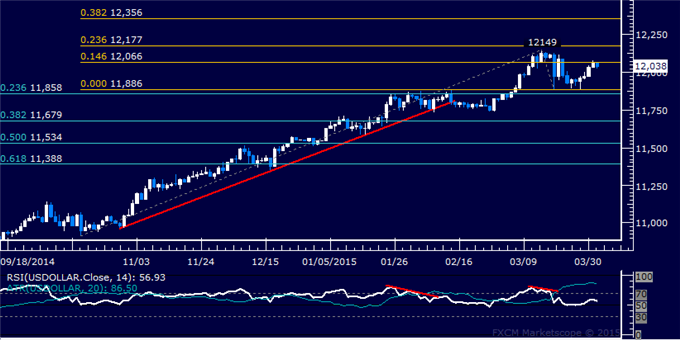
Prices continue to recover after finding support at the March swing low, rising for a fourth consecutive day. Near-term resistance is at 12066, the 14.6% Fibonacci expansion, with a break above that on a daily closing basis exposing the 12149-77 zone (23.6% level, March 13 high).
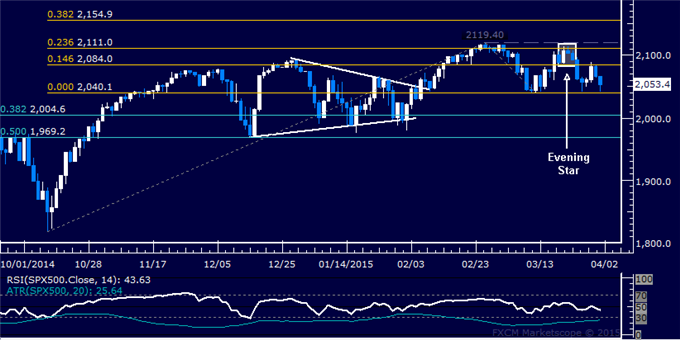
S&P 500 TECHNICAL ANALYSIS
Prices moved lower as expected
after putting in a bearish Evening Star candlestick pattern. A daily
close below the March 12low at 2040.10 exposes the 38.2% Fibonacci
retracement at 2004.60. Alternatively, a reversal above the 14.6% Fib
expansion at 2084.00 targets the 2111.00-19.40 area (23.6% threshold,
February 25 high).
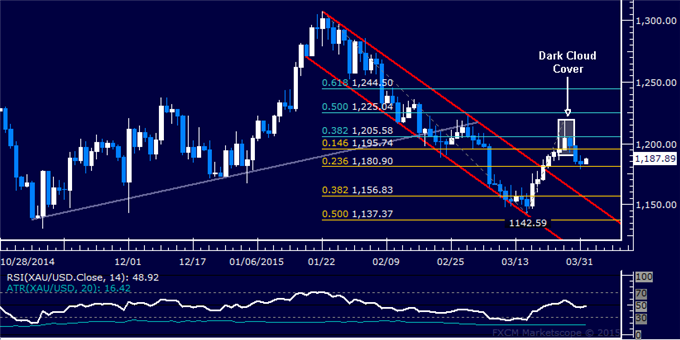
GOLD TECHNICAL ANALYSIS
Prices moved lower as expected after
putting in a bearish Dark Cloud Cover candlestick pattern. A daily close
below the 23.6% Fibonacci expansion at 1180.90 exposes the 38.2% level
at 1156.83. Alternatively, a reversal above the 14.6% expansion at
1195.74 targets the 38.2% Fib retracement at 1205.58.
CRUDE OIL TECHNICAL ANALYSIS
Prices reversed sharply lower
after finding resistance below the $60/barrel figure. A break below the
50% Fibonacci expansion at 54.53 exposes the 61.8% level at 53.30.
Alternatively, a reversal above the 38.2% Fib at 55.77 targets the March
26 high at 59.75.


 & AMD Framework")
")