
Technical Pattern Analysis for US Dollar, S&P 500, Gold and Crude Oil - Gold Prices May Be Readying to Decline Once Again

US DOLLAR TECHNICAL ANALYSIS
Prices turned lower as expected,
with prices digesting losses near monthly lows. A daily close below the
11858-86 area (23.6% Fibonacci retracement, March 18 low) exposes the
38.2% level at 11679.

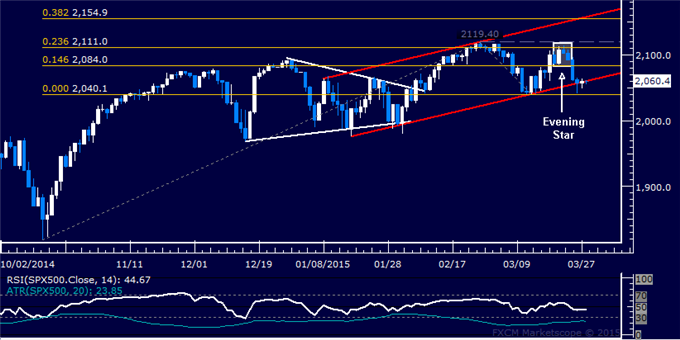
S&P 500 TECHNICAL ANALYSIS
Prices declined as expected
after putting in a bearish Evening Star candlestick pattern below
February’s swing high. A daily close belowchannel floor support at
2060.50 exposes the March 12 low at 2040.10. Alternatively, a reversal
above the 14.6% Fibonacci expansion at 2084.00 targets the 2111.00-19.40
area (23.6% level, February 25 high).
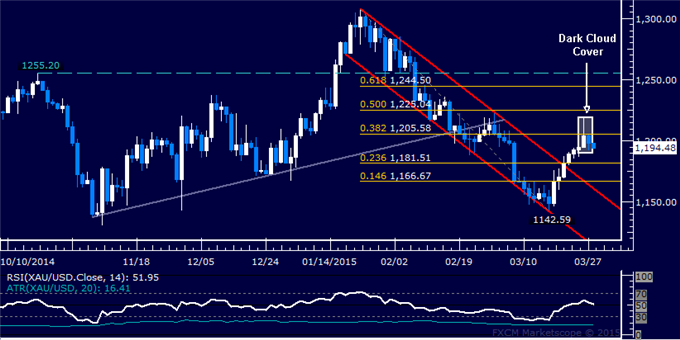
GOLD TECHNICAL ANALYSIS
Prices may be preparing to turn lower
after putting in a bearish Dark Cloud Cover candlestick pattern. A daily
close below the 23.6% Fibonacci retracement at 1181.51 exposes the
14.6% level at 1166.67. Alternatively, a reversal above the 38.2% Fib at
1205.58 targets the 50% retracement at 1225.04.
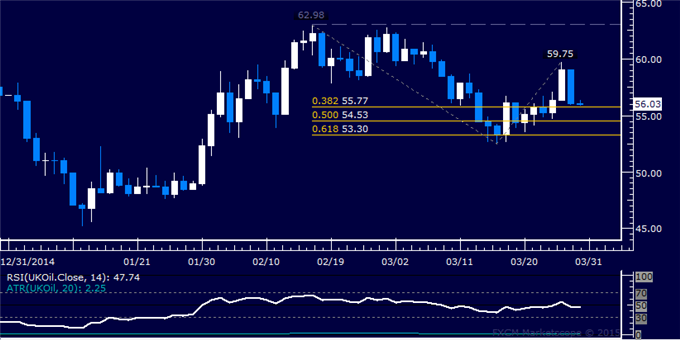
CRUDE OIL TECHNICAL ANALYSIS
Prices reversed sharply lower
after finding resistance below the $60/barrel figure. A break below the
38.2% Fibonacci expansion at 55.77 exposes the 50% level at 54.53.
Alternatively, a reversal above the March 26 high at 59.75 targets the
February 17 high at 62.98.


")

