

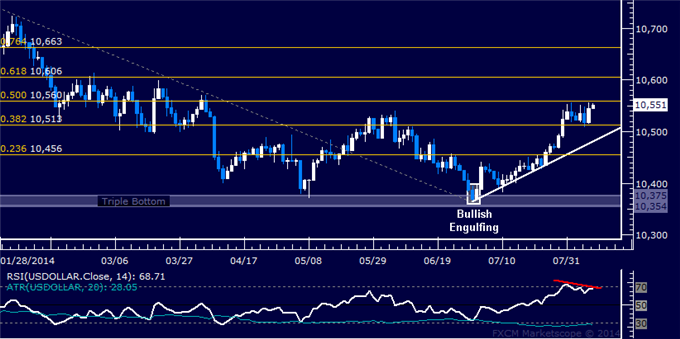
Prices may be setting up for a pullback after rallying as expected having put in a Bullish Engulfing candle pattern. The emergence of negative RSI divergence below resistance at 10560, the 50% Fibonacci retracement, warns of ebbing upside momentum. A daily close below the 38.2% level at 10513 exposes a rising trend line established from the July 1 low, now at 10481. Alternatively, a push through resistance opens the door for a test of the 61.8% Fib at 10606.


")

![[XAUUSD]: Weekly Liquidity Activation Points (timings), June 22-26, 2026](https://c.mql5.com/6/1013/splash-preview-771790.png "[XAUUSD]: Weekly Liquidity Activation Points (timings), June 22-26, 2026")