
Technical Analysis for US Dollar, S&P 500, Gold and Crude Oil - Gold Prices Continue Pullback, Crude Oil Flat-Lining

US DOLLAR TECHNICAL ANALYSIS
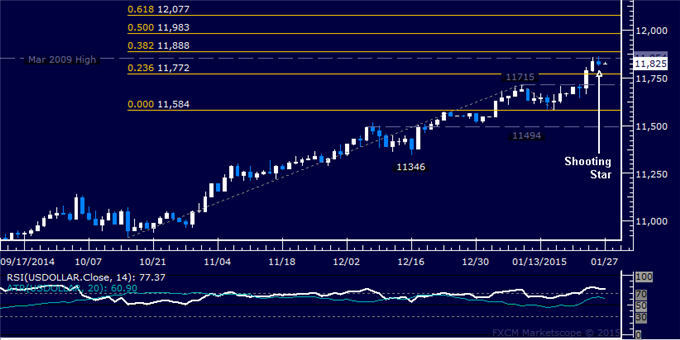
Prices put in a Shooting Star
candlestick pattern below multi-year resistance, hinting a pullback may
be ahead. A daily close below the 23.6% Fibonacci expansion at 11772
exposes the resistance-turned-support at 11715, the January 8 high.
S&P 500 TECHNICAL ANALYSIS
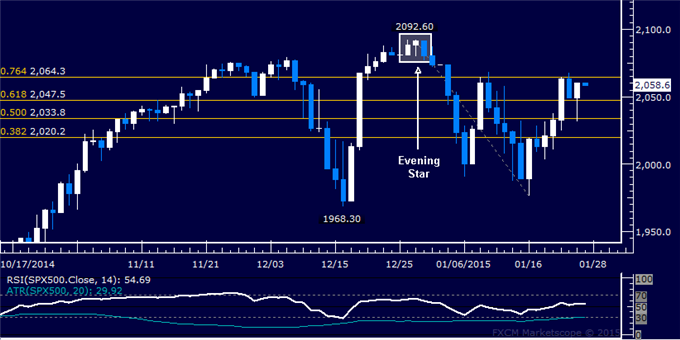
Prices declined as expected
after putting in a bearish Evening Star candlestick pattern. A daily
close below the 61.8% Fibonacci expansion at 2047.50 exposes the 50%
level at 2033.80. Alternatively, a turn back above the 76.4% Fib at
2064.30 aims for the December 29 high at 2092.60.
GOLD TECHNICAL ANALYSIS
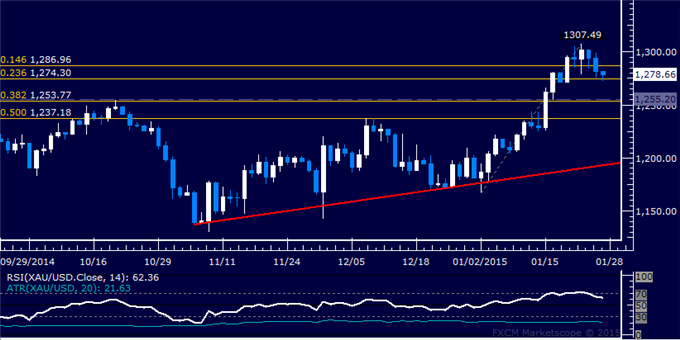
Prices fell for a second consecutive
day, with sellers now testing support at 1274.30 marked by the 23.6%
Fibonacci retracement. A break below this barrier on a daily closing
basis exposes the 1253.77-55.20 area marked by the October 21 high and
the 38.2% level.
CRUDE OIL TECHNICAL ANALYSIS
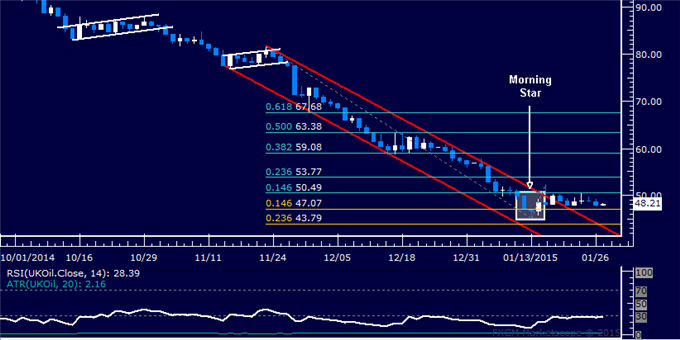
Prices are stalling having
attempted to recover as expected. A daily close above the 14.6%
Fibonacci retracement at 50.49 exposes the 23.6% level at 53.77.
Alternatively, a reversal below the 14.6% Fib expansion at 47.07 targets
the 23.6% threshold at 43.79.


![[iVISTscalp5]: TSI — Timing Strength Index](https://c.mql5.com/6/1015/splash-preview-772243.png "[iVISTscalp5]: TSI — Timing Strength Index")

