

Aussie found renewed buying interest at 0.9354 last week and has finally resumed recent upmove as price broke above resistance at 0.9461, bullishness remains for further gain to previous resistance at 0.9543, above there would encourage for headway to 0.9620-25 (50% Fibonacci retracement of the intermediate fall from 1.0582-0.8660), however, near term overbought condition should limit upside to 0.9690-00 and reckon 0.9750 would hold from here, bring retreat later.
We are keeping our count that top has been formed at 1.1081 (wave 5 of V) and major correction (A-B-C-X-A-B-C) has commenced, indicated downside targets at 0.9144 (38.2% Fibonacci retracement of entire rise from 0.6007-1.1081) and 0.8770 had been met and low has possibly been formed at 0.8660.
Our preferred count is that the rally from 0.6007 to 0.7270 (7 Jan
2009) is marked as wave A, the retreat to 0.6248 (2 Feb 2009) is wave B
and the subsequent upmove is labeled as wave C with wave (iii) and wave
(iv) ended at 0.8265 and 0.7700 respectively and wave (v) as well as 3
ended at 0.9407, then wave 4 ended at 0.8066 (instead of 0.8578). The
wave 5 has met our indicated projection target of 1.1060 and could ended
at 1.1081 and major A-B-C correction has commenced with A leg ended at
0.9388, followed by B leg at 1.0857 and C leg at 0.9581, D leg ended at
1.0625 and E leg is still in progress but should stay above 0.9581,
bring eventual rally later. Current breach of indicated support at
0.9581 suggests the major A-B-C-X-A-B-C correction is unfolding and
downside risk remains for weakness towards psychological support at
0.8500.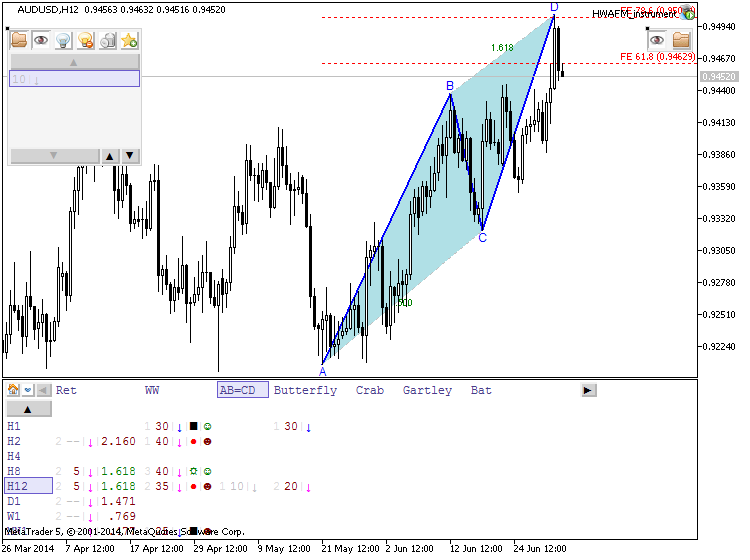
On the downside, whilst pullback to 0.9400 cannot be ruled out, reckon last week's low of 0.9354 would contain downside and bring another rise later. Only a break of 0.9322 support would abort and suggest a temporary top is possibly formed, risk correction to 0.9250 but it is necessary to see a breach of support at 0.9203 to provide confirmation, bring correction of recent upmove to 0.9135-40 (previous resistance) and later towards 0.9045-50, having said that, support at 0.8995 should remain intact.
Recommendation: Buy at 0.9400 for 0.9600 with stop below 0.9300.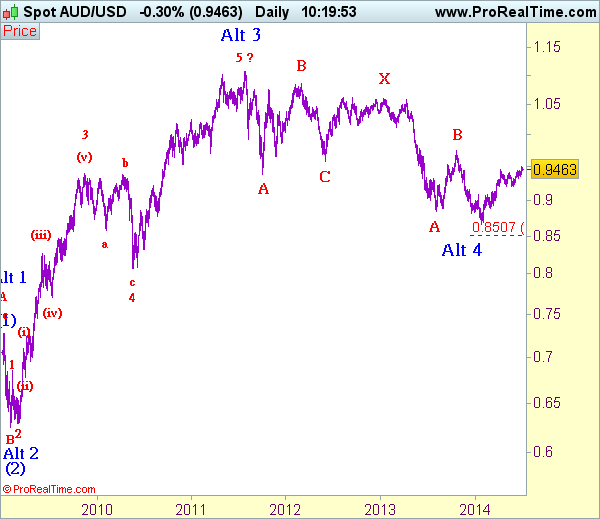
Our alternate count on the daily chart treated the top formed in 2008 at 0.9851 could be a larger degree wave I and was followed by a deep and sharp correction in wave II to 0.6007 and wave III is unfolding from there.
The long-term uptrend started from 0.4775 (2 Apr 2001) with an
impulsive structure. Wave I is labeled as 0.4775 to 0.9851 (15 Jul
2008), wave II has ended at 0.6007 (Oct 2008) and wave III is still in
progress which may extend further gain to 1.1265.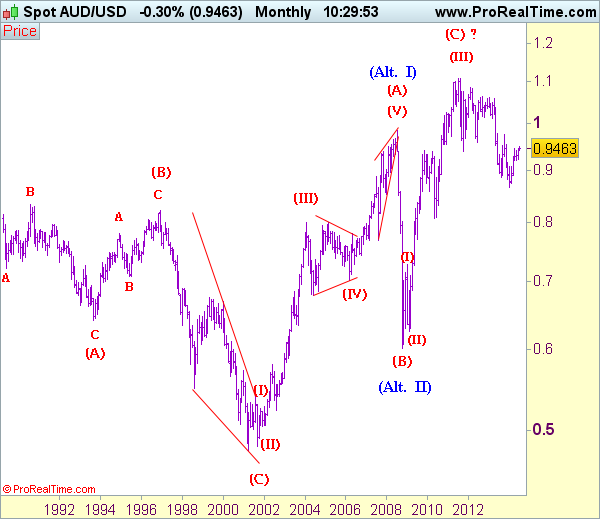


")
