

- While no indicator is perfect, they can help traders address probabilities in a market
- Moving Averages can be helpful, but often lack an active signaling mechanism
- MACD takes trading with moving averages one step further
The MACD Line
MACD is an acronym that is short for Moving Average Convergence Divergence, which is really just a long and drawn out way of saying it measures the relationship of moving averages. Rather than watching moving averages, these traders plotted the difference between the averages as an oscillator (shown below).
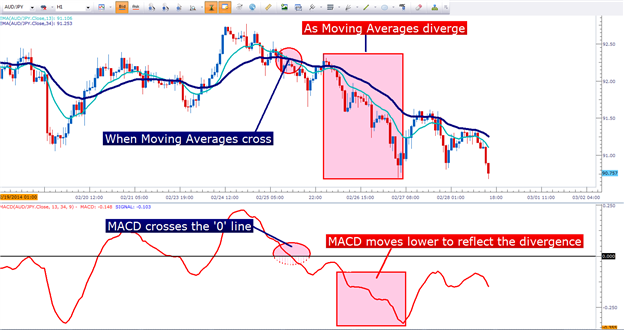
In this example, a 13 (in green) and 34 period (in blue) EMA is shown on the price chart. Notice when the two moving averages cross (highlighted with the red circle), MACD correspondingly crosses the ‘0’ line.
As the distance between the moving averages grows
larger (or diverges), MACD moves lower to illustrate the growing
difference that’s being seen in the EMAs.
The next part of the indicator is a key element to
trading with MACD, and this is called ‘the signal line.’ The signal line
is a moving average applied to MACD. By default, the signal line is
usually a 9 period EMA; but this is really up to each individual trader.
So, the signal line is a moving average based on the difference between
two other moving averages. While this may sound confusing, do not worry
– most charting packages can do this for you fairly easily and you
don’t have to perform the mathematical computations for each.
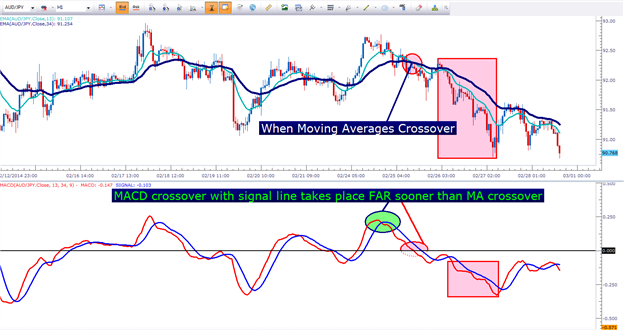
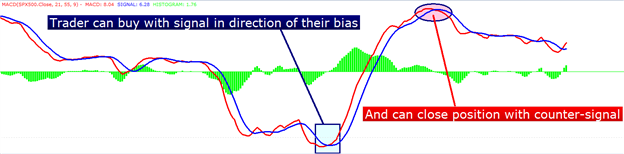
This is the benefit of MACD: The fact that it may allow for an earlier entry into a trend is what makes this such a phenomenal indicator. Sure, it won’t work all-of-the-time, but this is trading and there is nothing that works all-of-the-time.
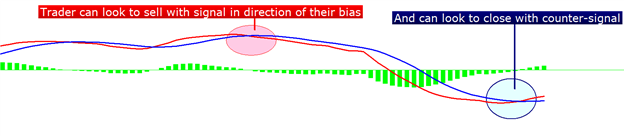
MACD can make for a fantastic indicator in strategies because of just this feature; and if often functions best as a ‘trigger’ into positions in trend-based strategies.
The Histogram
The last part of the indicator is a further extension of the mathematical relationship between all of these moving averages.
The histogram measures the difference between the MACD line, and the signal line. When MACD crosses the signal line, the histogram goes to a value of ‘0.’
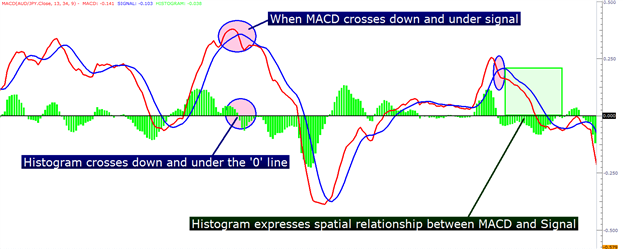
As you can see in the above image, as the MACD and the signal lines converge or diverge; the histogram will reflect this properly. As MACD falls further underneath the signal line, the histogram will print lower to reflect this growing difference.
As MACD crosses over the signal line, the histogram will crossover ‘0’ and will continue to move higher as long as MACD continues moving higher above the signal line.


 & AMD Framework")
")