
Unleashing Profit Potential: Mastering the MACD Trend Following Strategy


Breaking Down the Components of MACD
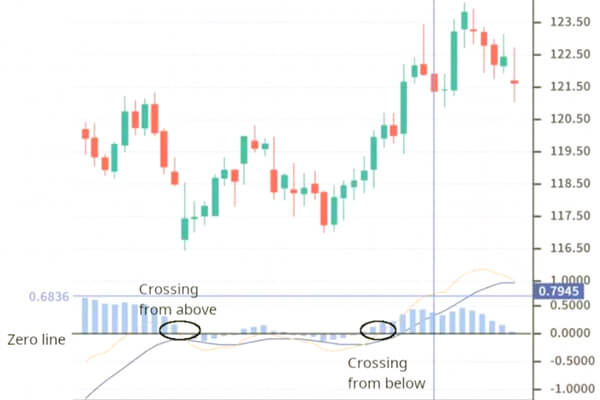
The MACD typically consists of three elements. The MACD line represents the 12-day Exponential Moving Average (EMA) subtracted from the 26-day EMA. The second element is the signal line, which is the 9-day EMA of the MACD. The final component is the MACD histogram, indicating the disparity between the MACD line and the signal line.
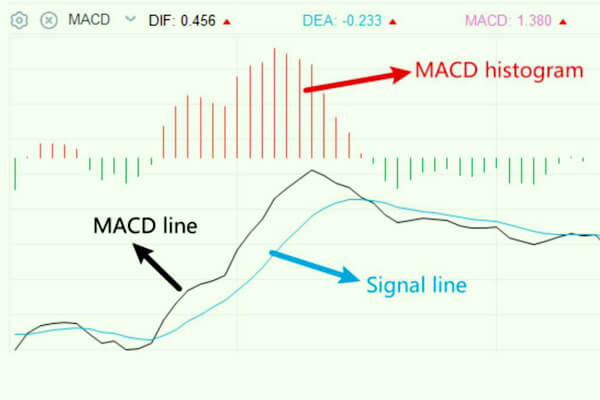
Nevertheless, the parameters of the MACD line can also modify based on the traders' preference. To differentiate these elements clearly, DIF consistently denotes the MACD line, while DEA always signifies the signal line.

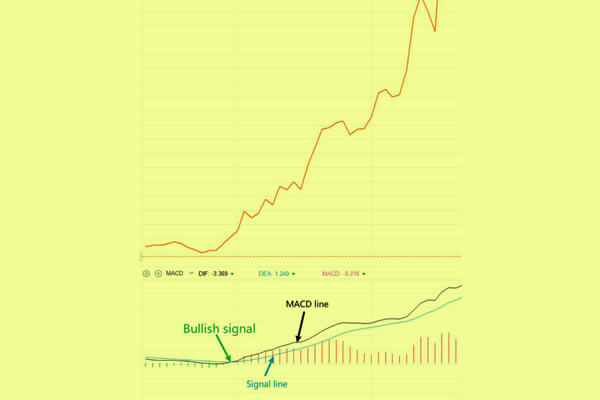
A bullish signal occurs when the MACD line moves up and crosses above the signal line.
Divergence
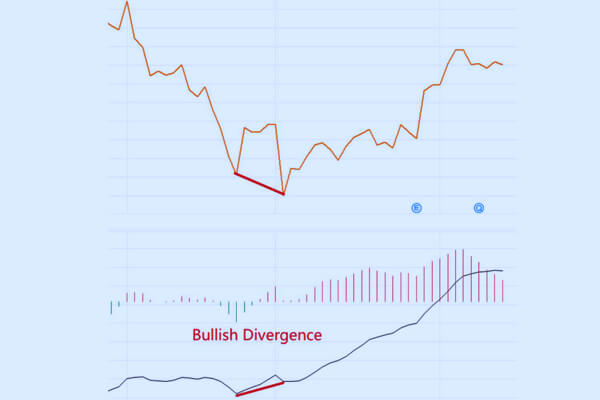
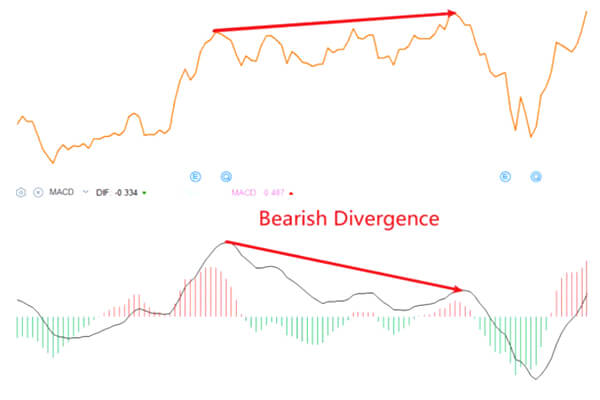
Divergence is displayed when the MACD line and the price exhibit contrasting trends. The divergence signal may suggest a potential shift in a trend. For instance, if the MACD line is moving upward while the price forms a lower low, a bullish divergence takes place, indicating that the price action may become positive.

Disadvantages of MACD
Furthermore, the MACD zero-cross acts as a lagging indicator since the price typically remains above the prior low before the MACD crosses the line from beneath. This can result in entering a long position later than you potentially could have.
What is the Importance of Candlestick Charts in the MACD Trend Following Strategy?
When implementing the MACD trend following strategy, a variety of indicators can enhance its effectiveness. However, many traders find that integrating candlestick charts significantly aids in visualization and decision-making processes.
How Do Support and Resistance Levels Enhance the MACD Trend Following Strategy?
Additionally, using support and resistance levels in conjunction with the MACD trend following strategy provides a robust framework for identifying potential reversal points and price targets. This combination allows traders to better gauge market sentiment and optimize their entry and exit points, ultimately enhancing their overall trading strategy.
How Can Traders Improve Their Success with the MACD Trend Following Strategy?
By leveraging these tools alongside the MACD trend following strategy, traders can make more informed decisions and improve their chances of success in the market. In summary, the MACD trend following strategy works best when complemented by candlestick analysis and support and resistance levels to facilitate more strategic trades.




