

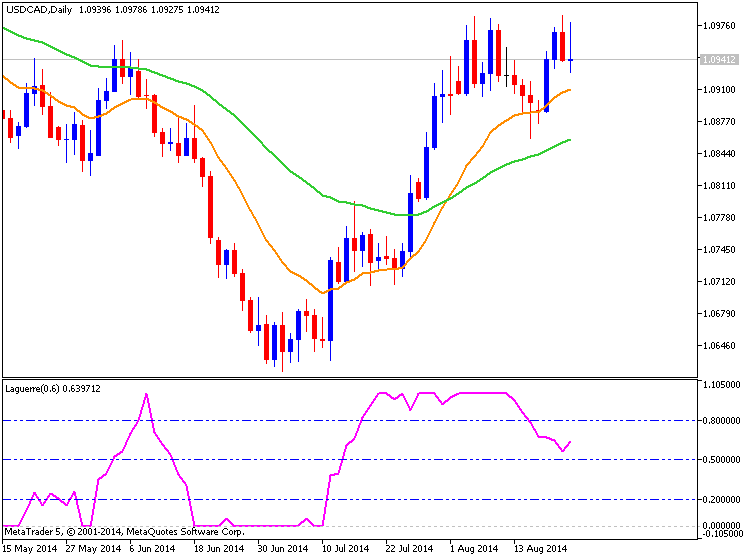
The USD/CAD pair
tried to break above the 1.10 level during the course of the week, but
failed yet again. This only tells us how important this area is, and
that breaking above it does in fact send this market much higher. With
that being the case though, we think it’s going to be difficult for
longer-term traders to place any money in this market unless we get a
significant pullback to the trend line, or if we get the aforementioned
break out. The market looks a bit choppy at this point, so we need to
see one of those two things to get involved.
Monthly Technical Analysis for August
The improving U.S. economy and the threat of an early interest rate hike
by the U.S. Federal Reserve helped boost the USD/JPY in July. This
developing trend is expected to continue if the U.S. economy continues
to be supported by strong jobs and inflation data in August.
The main trend is up on the daily chart. Last month’s price action suggests the Forex pair is set up to resume that uptrend. The main range is 93.783 to 105.434. The retracement zone formed by that range is 99.61 to 98.23. This is the major support area along with uptrending angles at 100.78 and 100.13.
Overtaking the downtrending angle at 101.93 this month is a sign of strength. The short-term range is 105.434 to 100.749. The pivot price created by this range is 103.09. Overtaking this pivot will put the USD/JPY in a strong position to continue the rally.
The next upside objective is 103.68. This is the last major resistance angle before the main top at 105.434.
The tone this month will be determined by investor reaction to the pivot at 103.09. This price is controlling the short-term direction of the market. The catalyst behind the move will be the continuing improvements in the U.S. labor market and inflation rate.


