Try using sinput.

Документация по MQL5: Основы языка / Переменные / Input переменные
- www.mql5.com
Input переменные - Переменные - Основы языка - Справочник MQL5 - Справочник по языку алгоритмического/автоматического трейдинга для MetaTrader 5
Thank you for your great system. If there is an english version for the source code/comment/parameter, it would be much better.
Apparently, in the article I failed to clearly state what this script is written for.
Here is a fragment of correspondence where I think I managed to find the right words.

Zhongquan Jiang #:
Thank you for your great system. If there is an english version for the source code/comment/parameter, it would be much better.
Please check out the English version here: https://www.mql5.com/en/articles/9922
Thank you for your great system. If there is an english version for the source code/comment/parameter, it would be much better.
I'm not a trader I just want to redeem the money I've invested I've had 800 reais invested since 28/01/2022
Thanks for sharing this informative article.
For some reason, in the tester the balance growth total is smaller, while yours is larger.
Why is that?
You are missing trading opportunities:
- Free trading apps
- Over 8,000 signals for copying
- Economic news for exploring financial markets
Registration
Log in
You agree to website policy and terms of use
If you do not have an account, please register

New article Visual evaluation of optimization results has been published:
In this article, we will consider how to build graphs of all optimization passes and to select the optimal custom criterion. We will also see how to create a desired solution with little MQL5 knowledge, using the articles published on the website and forum comments.
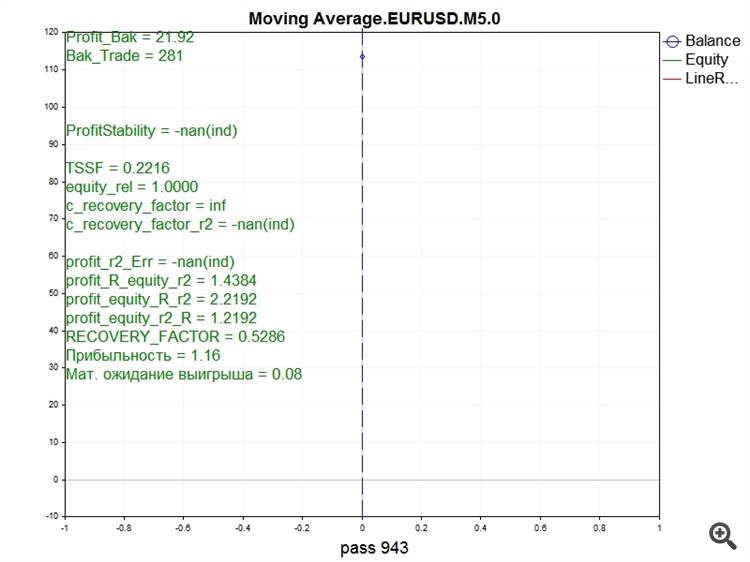
Here is how the graph created by the script looks like.
Below is the same graph from the Strategy Tester
I have shown here very similar graphs, but in most cases they will be different. This is because in the Strategy Tester deals along the X axis are bound to time, while the script plots graphs in which the X axis is bound to the number of trades. Also, because we have to write the minimum information in a frame to keep the file small enough, the equity values are not sufficient for analyzing the graphs created by the script. At the same time, this data is enough to have an initial evaluation of the efficiency of an optimization pass. It is also sufficient for calculating a custom optimization criterion.
Author: Aleksandr Slavskii