
Merrill patterns

Contents
Introduction
The first attempt to create a system of price patterns was made by Robert Levy in 1971. He applied five-point price fluctuation patterns and then checked if they had any significance. He did not achieve any notable results, but Arthur Merrill continued his work 10 years later.
He divided the patterns into two categories resembling M and W letters. Each category contains 16 patterns and its own subcategories. Merrill highlighted 6 subcategories:
- Uptrend
- Downtrend
- Triangle
- Expansion
- Head and shoulders
- Inverted head and shoulders
We are going to define the current relevance of the Merrill patterns using the application for testing them. Besides, it would be interesting to apply this model to various types of data — such as Close, High and Low price, as well as oscillators.
Definition and application
In order to clarify how and for what data we are going to apply Merrill patterns, we need to understand what they actually are. The main two categories are the patterns resembling the letters M and W. They are called M and W patterns. Each of the categories contains 16 patterns.
Fig. 1 represents 16 M patterns. As we can see, the difference is in the mutual arrangement of the five points that make up the pattern.
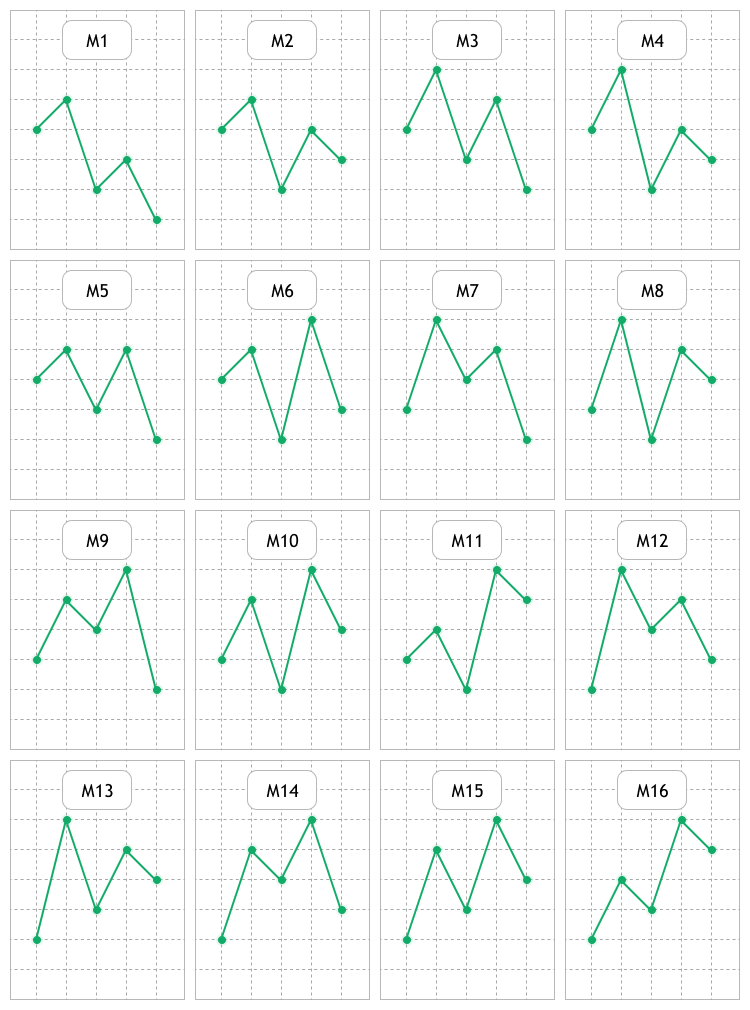
Fig. 1. Visual representation of М patterns
Fig. 2 displays 16 W patterns. We will search for these two groups on price charts and indicators, as well as study, evaluate and look for possible regularities.
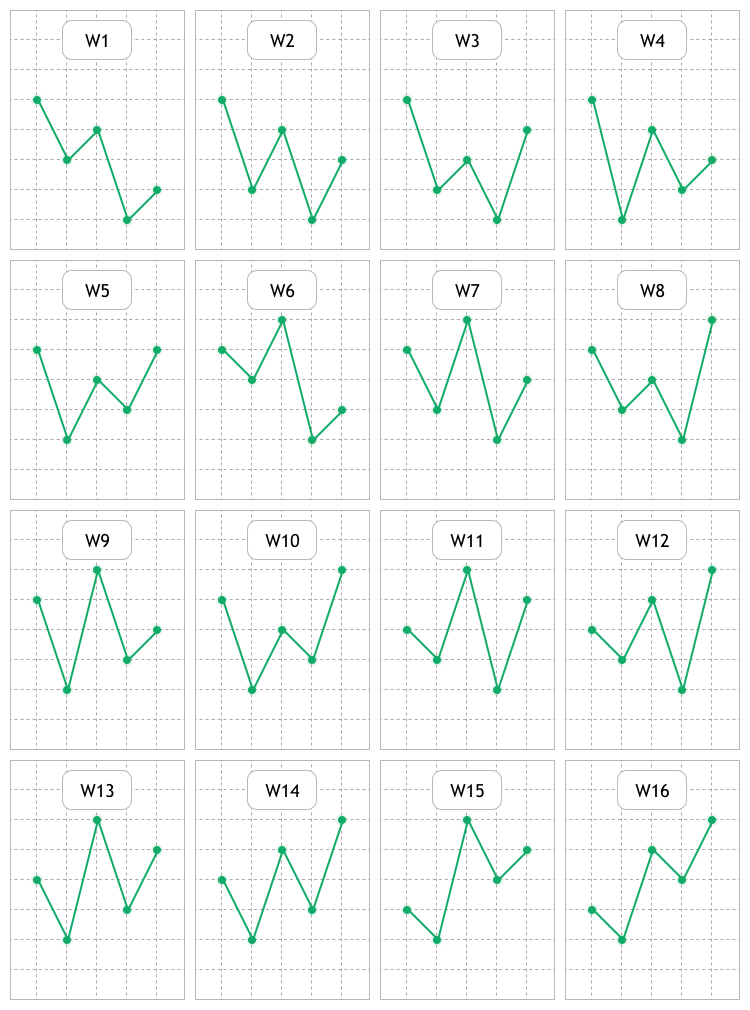
Fig. 2. Visual representation of W patterns
The idea behind any pattern boils down to the fact that when a particular formation appears, we can expect the price moving in a certain direction and make profit from that.
To make it as clear as possible in what area and how Merrill patterns are to be studied, here are a few examples. Fig. 3 displays a usual linear USDCAD H1 price chart. This type of representation is used not so frequently, because candles and bars have become more popular.
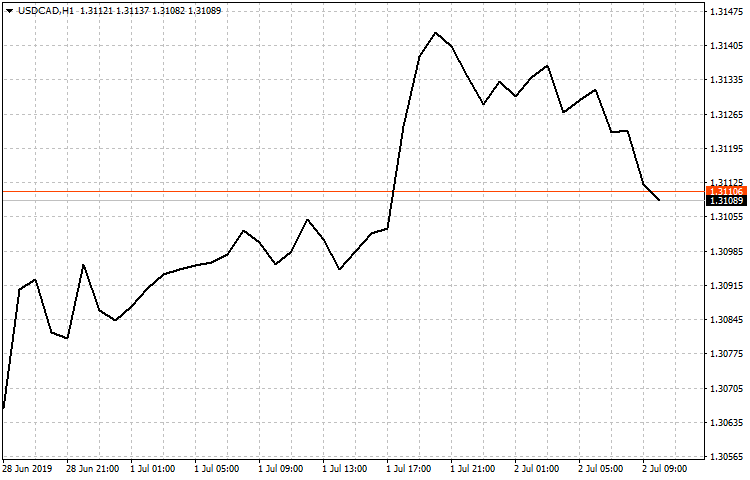
Fig. 3. Linear USDCAD H1 chart based on Close prices
Here we can already see a few patterns described above. This is to be the first area of study — applying to the linear chart based on Close prices. Also, we are going to check linear charts based on Open, High and Low prices.
The second area of study is to be consisted of oscillators, such as:
- Average True Range (ATR) — market volatility parameter.
- Commodity Channel Index (CCI) measures a symbol price deviation from its average price.
- DeMarker (DeM).
- Force Index (FRC).
- Williams’ Percent Range (WPR) — dynamic indicator defining overbought/oversold state.
- Relative Strength Index (RSI).
- Momentum — change of price of a financial instrument over a given time span.
The method I have suggested in the article Studying candlestick analysis techniques (Part I): Checking existing patterns is to be used as a method of evaluating patterns to be applied both to the price and to the oscillators mentioned above. The idea behind it is simple:
- Identifying the analyzed pattern on a specified sample section.
- Analyzing the price movement after identification.
- Collecting the data and calculating the pattern efficiency.
Developing the testing tool
Before starting the development, we need to define what settings it should contain. The tool is to consist of the panel with Analysis and Settings tabs. The parameters from the EA settings window are to be used as well. Totally, we are to have three sections featuring tools for working with patterns. Now let's describe the settings in each of the sections.
The Analysis tab contains:
- Two sets of buttons for selecting the types of tested patterns. There are also the All M and All W buttons for quick selection/deselection of М and W patterns.
- The set of buttons for selecting tested timeframes and the ALL button for selecting/deselecting the entire button group.
- The "Trend threshold (points)" input field. This is a profit in points the price should reach within a maximum of three candles after an analyzed Merrill pattern is identified.
- The button opening the dialog window for selecting Start and End dates, as well as the test time.
- The input field with the checkbox and the button is a filter for finding necessary trading symbols. It has one preset — Major. It displays major currency pairs. The check box disables the filter and shows all available trading symbols.
- Trading symbols selected in the table with the filter. After selecting them from the list, the pattern analysis is performed.
- The result table consisting of seven columns:
- Figure name. The column displays a name of an analyzed Merrill pattern, for example, M10 or W12.
- Found. Number of detected patterns of a specified type on a selected sample.
- Timeframe. A timeframe a specified pattern was analyzed on.
- P, Uptrend. A probability the price moves upwards by the "Trend threshold (points)" value after a pattern appears.
- P, Dntrend. A probability the price moves downwards by the "Trend threshold (points)" value after a pattern appears.
- K, UpTrend/K, DnTrend. This is a ratio described in my article Studying candlestick analysis techniques (Part I): Checking existing patterns. It evaluates how quickly the price reaches a specified profit after an analyzed pattern appears in the upward or downward direction of a trend.
Fig. 4 provides a visual implementation of all symbols and parameters described above.
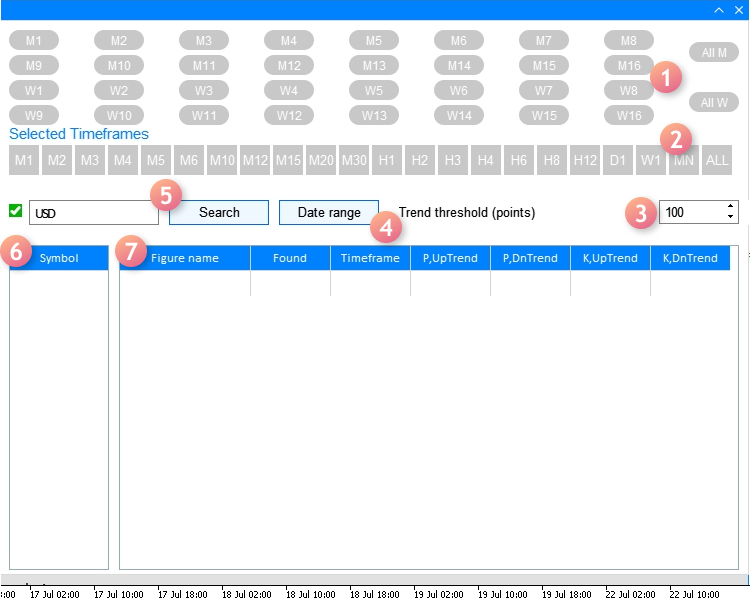
Fig. 4. Analysis tab
Now let's consider the Settings tab:
- Used indicator. Select an indicator the search and analysis of Merrill patterns is to be applied to.
- Weighting coefficients are used when calculating K, UpTrend/DnTrend ratios described above.
- Interface language. The drop-down list of selecting the interface language: English or Russian.
The tab appearance with the settings is displayed on Fig. 5 below:
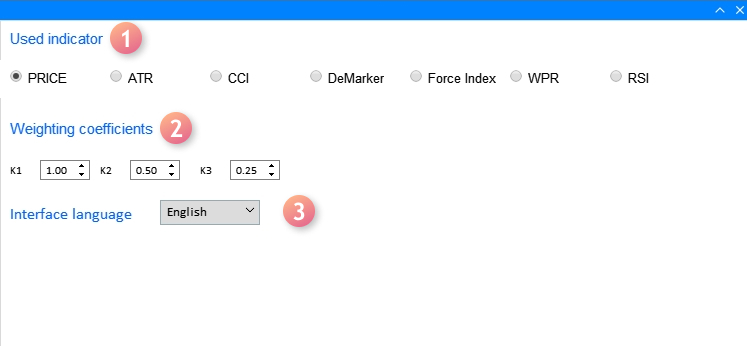
Fig. 5. Settings tab
The last section applies the "EA settings" window (F7 hotkey) and features the settings of applied indicators listed in "Used indicator." Fig. 6 displays the window of the settings last section.
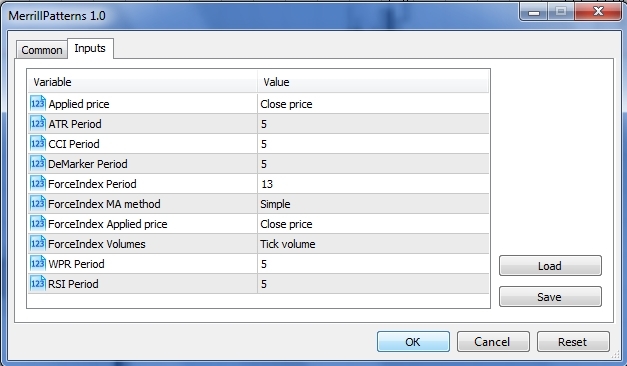
Fig. 6. Settings window of used indicators
We should consider the following nuances when defining the settings in the window:
- The first one ("Applied price") applies the ENUM_APPLIED_PRICE enumeration type variable having seven values: Open price, Close price, High price and Low price, as well as median, typical and weighted average prices. When performing an analysis based on a chart price, the first four values should be used because the last three ones are designed for calculating indicators.
- If you want to use indicators in analyzing patterns, the "Applied price" setting affects the indicators using the ENUM_APPLIED_PRICE type variable in their calculations, namely: ATR, CCI and RSI.
Now let's consider the implementation of the app interface, as well as the methods of searching and analyzing the Merrill patterns.
To develop the GUI, we use the CreateGUI() method consisting of the CreateWindow() methods creating the interface main window and the CreateWindowSetting1() dialog window for selecting a time range for studying.
//+------------------------------------------------------------------+
//| Create the program GUI                                           |
//+------------------------------------------------------------------+
bool CProgram::CreateGUI(void)
  {
//--- Create the panel
   if(!CreateWindow("Merrill Patterns"))
      return(false);
//--- Create the dialog window
   if(!CreateWindowSetting1("Setting dates"))
      return(false);
//--- Complete GUI creation
   CWndEvents::CompletedGUI();
   return(true);
  }
Now let's see what each method consists of. We will focus our attention on the interface main window first. It consists of the implementation of the Analysis tab made of the elements described in Fig. 4.
//+------------------------------------------------------------------+
//| Analyze tab                                                      |
//+------------------------------------------------------------------+
//--- Create the pattern set buttons
   if(!CreatePatternSet(m_patterns,10,10))
      return(false);
//--- Timeframe header
   if(!CreateTFLabel(m_text_labels[1],10,105,0))
      return(false);
//--- Create the timeframe set buttons
   if(!CreateTimeframeSet(m_timeframes,10,125,0))
      return(false);
//--- Field for searching the symbol filter
   if(!CreateSymbolsFilter(m_symb_filter1,m_request1,10,180,0))
      return(false);
//--- Create the button for selecting a date range
   if(!CreateDateRange(m_request3,280,180,0))
      return(false);
//--- Create the field for entering the profit threshold value
   if(!CreateThresholdValue(m_threshold1,400,180,100,0))
      return(false);
//--- Create the symbol table
   if(!CreateSymbTable(m_symb_table1,10,225,0))
      return(false);
//--- Create the result table
   if(!CreateTable1(m_table1,120,225,0))
      return(false);
And of the Settings tab described in Fig. 5.
//+------------------------------------------------------------------+
//| Settings tab                                                     |
//+------------------------------------------------------------------+
//---
   if(!CreateButtonsGroup1(10,50))
      return(false);
//--- Text labels
   if(!CreateTextLabel(m_text_labels[0],10,100))
      return(false);
   if(!CreateTextLabel(m_text_labels[3],10,10))
      return(false);
//--- Input fields
   if(!CreateCoef(m_coef1,10,140,"K1",1))
      return(false);
   if(!CreateCoef(m_coef2,100,140,"K2",0.5))
      return(false);
   if(!CreateCoef(m_coef3,200,140,"K3",0.25))
      return(false);
   if(!CreateLanguageSetting(m_lang_setting,10,180,1))
      return(false);
//--- Status bar
   if(!CreateStatusBar(1,26))
      return(false);
//---
   return(true);
  }
More detailed implementation of each of the applied methods adding interface elements can be found in the attached source codes.
The method implementing the dialog window for setting a temporary sampling looks as follows:
//+---------------------------------------------------------------------------------+
//| Create the dialog window for selecting the range of dates in the Analysis tab   |
//+---------------------------------------------------------------------------------+
bool CProgram::CreateWindowSetting1(const string caption_text)
  {
//--- Add the window pointer to the window array
   CWndContainer::AddWindow(m_window[2]);
//--- Coordinates
   int x=m_request3.X();
   int y=m_request3.Y()+m_request3.YSize();
//--- Properties
   m_window[2].XSize(372);
   m_window[2].YSize(230);
   m_window[2].WindowType(W_DIALOG);

//--- Create the form
   if(!m_window[2].CreateWindow(m_chart_id,m_subwin,caption_text,x,y))
      return(false);
//---
   if(!CreateCalendar(m_calendar1,m_window[2],10,25,D'01.01.2019',1))
      return(false);
   if(!CreateCalendar(m_calendar2,m_window[2],201,25,m_calendar2.Today(),1))
      return(false);
//---
   if(!CreateTimeEdit(m_time_edit1,m_window[2],10,200,"Time",1))
      return(false);
   if(!CreateTimeEdit(m_time_edit2,m_window[2],200,200,"Time",1))
      return(false);
//---
   return(true);
  }
Now let's turn our attention to the methods of searching, studying and evaluating the patterns. To achieve this, we need to track the entire sequence of the algorithm actions. First, have a look at the MerrillPatterns.mq5 file where this algorithm starts.
//--- Include the application class
#include "Program.mqh"
CProgram program;
//+------------------------------------------------------------------+
//| EA inputs                                                        |
//+------------------------------------------------------------------+
input ENUM_APPLIED_PRICE   Inp_Price1              =  PRICE_CLOSE;   // Applied price
input int                  Inp_ATR_Peroid          =  5;             // ATR Period
input int                  Inp_CCI_Peroid          =  5;             // CCI Period
input int                  Inp_DeM_Peroid          =  5;             // DeMarker Period
input int                  Inp_ForcePeriod         =  13;            // ForceIndex Period
input ENUM_MA_METHOD       Inp_ForceMAMethod       =  MODE_SMA;      // ForceIndex MA method
input ENUM_APPLIED_PRICE   Inp_ForceAppliedPrice   =  PRICE_CLOSE;   // ForceIndex Applied price
input ENUM_APPLIED_VOLUME  Inp_ForceAppliedVolume  =  VOLUME_TICK;   // ForceIndex Volumes
input int                  Inp_WPR_Period          =  5;             // WPR Period
input int                  Inp_RSI_Period          =  5;             // RSI Period
//+------------------------------------------------------------------+
//| Expert initialization function                                   |
//+------------------------------------------------------------------+
int OnInit(void)
  {
//---
   program.OnInitEvent();
//--- Set the trading panel
   if(!program.CreateGUI())
     {
      ::Print(__FUNCTION__," > Failed to create GUI!");
      return(INIT_FAILED);
     }
//---
   program.InitializePrice(Inp_Price1);
   program.InitializeATR(Inp_ATR_Peroid);
   program.InitializeCCI(Inp_CCI_Peroid);
   program.InitializeDeM(Inp_DeM_Peroid);
   program.InitializeForce(Inp_ForcePeriod,Inp_ForceMAMethod,Inp_ForceAppliedPrice,Inp_ForceAppliedVolume);
   program.InitializeWPR(Inp_WPR_Period);
   program.InitializeRSI(Inp_RSI_Period);
   return(INIT_SUCCEEDED);
  }
Apart from the indicator inputs, the search for a graphical shell is performed in the OnInit() section followed by initializing the data set in the Properties window. All methods pass the external settings to the internal variables.
//---
   void              InitializePrice(ENUM_APPLIED_PRICE price)    { m_applied_price=price;        }
   void              InitializeATR(int period)                    { m_atr_period=period;          }
   void              InitializeCCI(int period)                    { m_cci_period=period;          }
   void              InitializeDeM(int period)                    { m_dem_period=period;          }
   void              InitializeWPR(int period)                    { m_wpr_period=period;          }
   void              InitializeRSI(int period)                    { m_rsi_period=period;          }
//+------------------------------------------------------------------+
//|                                                                  |
//+------------------------------------------------------------------+
void CProgram::InitializeForce(int period,ENUM_MA_METHOD ma_method,ENUM_APPLIED_PRICE price,ENUM_APPLIED_VOLUME volume)
  {
   m_force_period=period;
   m_force_ma_method=ma_method;
   m_force_applied_price=price;
   m_force_applied_volume=volume;
  }
//+-----------------------------------------------------------------
After that, the application is ready to be used, while the remaining settings are passed to the created GUI. I have already mentioned that launching the calculation is performed by choosing a currency symbol from the symbol table (pos. 6 in Fig. 4). It is also performed after setting the "Trend threshold" (pos. 3 in Fig. 4). Both events launch the ChangeSymbol1() method to start collecting detected data to prepare it for analysis.
//+------------------------------------------------------------------+
//| Select a symbol in the Analysis tab                              |
//+------------------------------------------------------------------+
bool CProgram::ChangeSymbol1(const long id)
  {
//--- Check the element ID
   if(id!=m_symb_table1.Id())
      return(false);
//--- Exit if the string is not highlighted
   if(m_symb_table1.SelectedItem()==WRONG_VALUE)
     {
      //--- Show full description of a symbol in the status bar
      m_status_bar.SetValue(0,"Symbol for analysis not selected");
      m_status_bar.GetItemPointer(0).Update(true);
      return(false);
     }
//--- Get a selected symbol
   string symbol=m_symb_table1.GetValue(0,m_symb_table1.SelectedItem());
//--- Show the full symbol description in the status bar
   string val=(m_lang_index==0)?"Выбранный символ: ":"Selected symbol: ";
   m_status_bar.SetValue(0,val+::SymbolInfoString(symbol,SYMBOL_DESCRIPTION));
   m_status_bar.GetItemPointer(0).Update(true);
//---
   GetResult(symbol);
   return(true);
  }
The essence of its work is to define a selected trading symbol from the symbol table and pass its value to the status bar and the GetResult() method. Let's consider the method in more details since all the main work takes place in it.
//+------------------------------------------------------------------+
//| Handle pattern search results                                    |
//+------------------------------------------------------------------+
bool CProgram::GetResult(const string symbol)
  {
//--- Structure for evaluating pattern efficiency
   RATING_SET m_coef[];
//--- Figure types
   PATTERN_TYPE pattern_types[];
//---
   ArrayResize(pattern_types,33);
   for(int i=0;i<33;i++)
     {
      if(i==16)
         pattern_types[i]=-1;
      if(i<16)
         pattern_types[i]=PATTERN_TYPE(i);
      if(i>16)
         pattern_types[i]=PATTERN_TYPE(i-1);
     }
//--- Define selected timeframes
   GetTimeframes(m_timeframes,m_cur_timeframes);
   int total=ArraySize(m_cur_timeframes);
//--- Check for at least one selected timeframe
   if(total<1)
     {
      if(m_lang_index==0)
         MessageBox("Вы не выбрали рабочий таймфрейм!","Ошибка",MB_OK);
      else if(m_lang_index==1)
         MessageBox("You have not selected working timeframe!","Error",MB_OK);
      return(false);
     }
   int count=0;
   m_total_row=0;
//--- Remove all strings
   m_table1.DeleteAllRows();
//--- Get date range
   datetime start=StringToTime(TimeToString(m_calendar1.SelectedDate(),TIME_DATE)+" "+(string)m_time_edit1.GetHours()+":"+(string)m_time_edit1.GetMinutes()+":00");
   datetime end=StringToTime(TimeToString(m_calendar2.SelectedDate(),TIME_DATE)+" "+(string)m_time_edit2.GetHours()+":"+(string)m_time_edit2.GetMinutes()+":00");
//--- Check selected dates
   if(start>end || end>TimeCurrent())
     {
      if(m_lang_index==0)
         MessageBox("Неправильно выбран диапазон дат!","Ошибка",MB_OK);
      else if(m_lang_index==1)
         MessageBox("Incorrect date range selected!","Error",MB_OK);
      return(false);
     }
//---
   for(int k=0;k<33;k++)
     {
      if(k==16)
         continue;
      //--- Get selected patterns for analysis
      if(m_patterns[k].IsPressed())
        {
         ArrayResize(m_m_total,total);
         ArrayResize(m_coef,total);
         ZeroMemory(m_m_total);
         ZeroMemory(m_coef);
         count++;
         //--- Calculate by timeframes
         for(int j=0;j<total;j++)
           {
            double arr[];
            //--- Get data for analysis
            int copied=GetData(m_buttons_group1.SelectedButtonIndex(),symbol,m_cur_timeframes[j],start,end,arr);
            //---
            if(copied<9)
               MessageBox("Insufficient data for analysis","Error",MB_OK);
            for(int i=0;i<copied;i++)
              {
               if(i>copied-9)
                  continue;
               //--- Pattern search condition
               double A=arr[i];
               double B=arr[i+1];
               double C=arr[i+2];
               double D=arr[i+3];
               double E=arr[i+4];
               if(GetPatternType(A,B,C,D,E)==pattern_types[k])
                 {
                  m_m_total[j]++;
                  GetCategory(symbol,i+5,m_coef[j],m_cur_timeframes[j],m_threshold_value1);
                 }
              }
            //--- Add the result to the table
            AddRow(m_table1,m_patterns[k].LabelText(),m_coef[j],m_m_total[j],m_cur_timeframes[j]);
           }
        }
     }
//---
   if(count>0)
     {
      //---
      m_table1.DeleteRow(m_total_row);
      //--- Update the table
      m_table1.Update(true);
      m_table1.GetScrollVPointer().Update(true);
     }
   else
     {
      if(m_lang_index==0)
         MessageBox("Вы не выбрали паттерн!","Ошибка",MB_OK);
      else if(m_lang_index==1)
         MessageBox("You have not chosen a pattern!","Error",MB_OK);
     }
   return(true);
  }
First, I need to explain the types of entered variables at the very start of the method. The first one is the RATING_SET structure.
struct RATING_SET
  {
   int               a_uptrend;
   int               b_uptrend;
   int               c_uptrend;
   int               a_dntrend;
   int               b_dntrend;
   int               c_dntrend;
  };
It contains 6 int type variables and is necessary for adding data on how often the price moves in a specified direction after identifying a pattern and how quickly the price reaches it. For example, suppose that we have an uptrend and the trend threshold set to 100 points on 5 digits, while the price covers this value within a single candle. In this case, the a_uptrend variable receives the value of one. If the price reaches 100 points within 2 candles, then the value is passed to the b_uptrend variable. We will use the m_coef[] structure array in our method.
The second variable type is PATTERN_TYPE. This is an enumeration gathering all types of Merrill patterns.
//+------------------------------------------------------------------+
//| Figure type                                                      |
//+------------------------------------------------------------------+
enum PATTERN_TYPE
  {
   M1,M2,M3,M4,M5,M6,M7,M8,
   M9,M10,M11,M12,M13,M14,M15,M16,
   W1,W2,W3,W4,W5,W6,W7,W8,
   W9,W10,W11,W12,W13,W14,W15,W16
  };
The pattern_types[] enumeration array is applied in the method. Next goes the check — what timeframes were selected for working in the application. This data is handled by the GetTimeframes() method.
//+------------------------------------------------------------------+
//| Get the array of selected timeframes                             |
//+------------------------------------------------------------------+
void  CProgram::GetTimeframes(CButton &buttons[],ENUM_TIMEFRAMES &timeframe[])
  {
   string tf[22]=
     {
      "M1","M2","M3","M4","M5","M6","M10","M12","M15","M20","M30",
      "H1","H2","H3","H4","H6","H8","H12","D1","W1","MN"
     };
   int j=0;
   ArrayResize(timeframe,22);
   for(int i=0;i<22;i++)
     {
      if(buttons[i].IsPressed())
        {
         timeframe[j]=StringToTimeframe(tf[i]);
         j++;
        }
     }
   ArrayResize(timeframe,j);
  }
The method writes this to the preliminarily set m_cur_timeframes[] timeframe array. Next, get the time range for work.
In the first loop, we start checking pressing the selected button responsible for the pattern types and defining a set of studied patterns. In the next loop, each of the patterns is studied on timeframes selected before that. At this stage, the question arises, which data the preliminarily set pattern and timeframe settings should be applied to. The GetData() method is responsible for that, as it defines the settings you have set in the EA properties window, as well as the applied indicator (pos.1 in Fig. 5) in the application settings tab.
//+------------------------------------------------------------------+
//|                                                                  |
//+------------------------------------------------------------------+
int CProgram::GetData(int index,string symb,ENUM_TIMEFRAMES tf,datetime start,datetime end,double &arr[])
  {
//---
   int Handle=INVALID_HANDLE,copied;
//--- Close price
   if(index==0)
     {
      MqlRates rt[];
      ZeroMemory(rt);
      copied=CopyRates(symb,tf,start,end,rt);
      ArrayResize(arr,copied);
      for(int i=0;i<copied;i++)
        {
         arr[i]=rt[i].close;
         if(m_applied_price==PRICE_OPEN)
            arr[i]=rt[i].open;
         else if(m_applied_price==PRICE_CLOSE)
            arr[i]=rt[i].close;
         else if(m_applied_price==PRICE_HIGH)
            arr[i]=rt[i].high;
         else if(m_applied_price==PRICE_LOW)
            arr[i]=rt[i].low;
        }
      return(copied);
     }
//--- ATR
   if(index==1)
      Handle=iATR(symb,tf,m_atr_period,m_applied_price);
//--- CCI
   if(index==2)
      Handle=iCCI(symb,tf,m_cci_period,m_applied_price);
//--- DeMarker
   if(index==3)
      Handle=iDeMarker(symb,tf,m_dem_period);
//--- Force Index
   if(index==4)
      Handle=iForce(symb,tf,m_force_period,m_force_ma_method,m_force_applied_volume);
//--- WPR
   if(index==5)
      Handle=iWPR(symb,tf,m_wpr_period);
//--- RSI
   if(index==6)
      Handle=iRSI(symb,tf,m_rsi_period,m_applied_price);
//---
   if(Handle==INVALID_HANDLE)
     {
      Print("Failed to get indicator handle");
      return(-1);
     }
   copied=CopyBuffer(Handle,0,start,end,arr);
   return(copied);
  }
After receiving data for analysis, the algorithm moves on to the GetPatternType() method used to search for all previously set patterns on selected timeframes.
//+------------------------------------------------------------------+
//| Define the patterns                                              |
//+------------------------------------------------------------------+
PATTERN_TYPE CProgram::GetPatternType(double A,double B,double C,double D,double E)
  {
//--- M1
   if(B>A && A>D && D>C && C>E)
      return(M1);
//--- M2
   if(B>A && A>D && D>E && E>C)
      return(M2);
//--- M3
   if(B>D && D>A && A>C && C>E)
      return(M3);
//--- M4
   if(B>D && D>A && A>E && E>C)
      return(M4);
//--- M5
   if(D>B && B>A && A>C && C>E)
      return(M5);
//--- M6
   if(D>B && B>A && A>E && E>C)
      return(M6);
//--- M7
   if(B>D && D>C && C>A && A>E)
      return(M7);
//--- M8
   if(B>D && D>E && E>A && A>C)
      return(M8);
//--- M9
   if(D>B && B>C && C>A && A>E)
      return(M9);
//--- M10
   if(D>B && B>E && E>A && A>C)
      return(M10);
//--- M11
   if(D>E && E>B && B>A && A>C)
      return(M11);
//--- M12
   if(B>D && D>C && C>E && E>A)
      return(M12);
//--- M13
   if(B>D && D>E && E>C && C>A)
      return(M13);
//--- M14
   if(D>B && B>C && C>E && E>A)
      return(M14);
//--- M15
   if(D>B && B>E && E>C && C>A)
      return(M15);
//--- M16
   if(D>E && E>B && B>C && C>A)
      return(M16);
//--- W1
   if(A>C && C>B && B>E && E>D)
      return(W1);
//--- W2
   if(A>C && C>E && E>B && B>D)
      return(W2);
//--- W3
   if(A>E && E>C && C>B && B>D)
      return(W3);
//--- W4
   if(A>C && C>E && E>D && D>B)
      return(W4);
//--- W5
   if(A>E && E>C && C>D && D>B)
      return(W5);
//--- W6
   if(C>A && A>B && B>E && E>D)
      return(W6);
//--- W7
   if(C>A && A>E && E>B && B>D)
      return(W7);
//--- W8
   if(E>A && A>C && C>B && B>D)
      return(W8);
//--- W9
   if(C>A && A>E && E>D && D>B)
      return(W9);
//--- W10
   if(E>A && A>C && C>D && D>B)
      return(W10);
//--- W11
   if(C>E && E>A && A>B && B>D)
      return(W11);
//--- W12
   if(E>C && C>A && A>B && B>D)
      return(W12);
//--- W13
   if(C>E && E>A && A>D && D>B)
      return(W13);
//--- W14
   if(E>C && C>A && A>D && D>B)
      return(W14);
//--- W15
   if(C>E && E>D && D>A && A>B)
      return(W15);
//--- W16
   if(E>C && C>D && D>A && A>B)
      return(W16);
   return(-1);
  }
When detecting the pattern, it is evaluated using the GetCategory() method. The previously defined RATING_SET type structure array is used here.
//+------------------------------------------------------------------+
//| Define the profit categories                                     |
//+------------------------------------------------------------------+
bool CProgram::GetCategory(const string symbol,const int shift,RATING_SET &rate,ENUM_TIMEFRAMES timeframe,int threshold)
  {
   MqlRates rt[];
   datetime start=StringToTime(TimeToString(m_calendar1.SelectedDate(),TIME_DATE)+" "+(string)m_time_edit1.GetHours()+":"+(string)m_time_edit1.GetMinutes()+":00");
   start+=PeriodSeconds(timeframe)*shift;
   int copied=CopyRates(symbol,timeframe,start,4,rt);
//--- Get the data of previous candles
   if(copied<4)
      return(false);
   double high1,high2,high3,low1,low2,low3,close0,point;
   close0=rt[0].close;
   high1=rt[1].high;
   high2=rt[2].high;
   high3=rt[3].high;
   low1=rt[1].low;
   low2=rt[2].low;
   low3=rt[3].low;
   if(!SymbolInfoDouble(symbol,SYMBOL_POINT,point))
      return(false);

//--- Check for Uptrend
   if((int)((high1-close0)/point)>=threshold)
     {
      rate.a_uptrend++;
     }
   else if((int)((high2-close0)/point)>=threshold)
     {
      rate.b_uptrend++;
     }
   else if((int)((high3-close0)/point)>=threshold)
     {
      rate.c_uptrend++;
     }

//--- Check for Downtrend
   if((int)((close0-low1)/point)>=threshold)
     {
      rate.a_dntrend++;
     }
   else if((int)((close0-low2)/point)>=threshold)
     {
      rate.b_dntrend++;
     }
   else if((int)((close0-low3)/point)>=threshold)
     {
      rate.c_dntrend++;
     }
   return(true);
  }
Handled evaluation data is passed to the AddRow() method, which calculates probability values and efficiency rates and adds them to the result table.
//+------------------------------------------------------------------+
//|                                                                  |
//+------------------------------------------------------------------+
void CProgram::AddRow(CTable &table,string pattern_name,RATING_SET &rate,int found,ENUM_TIMEFRAMES timeframe)
  {
   int row=m_total_row;
   double p1,p2,k1,k2;
   int sum1=0,sum2=0;
   sum1=rate.a_uptrend+rate.b_uptrend+rate.c_uptrend;
   sum2=rate.a_dntrend+rate.b_dntrend+rate.c_dntrend;
//---
   p1=(found>0)?(double)sum1/found*100:0;
   p2=(found>0)?(double)sum2/found*100:0;
   k1=(found>0)?(m_k1*rate.a_uptrend+m_k2*rate.b_uptrend+m_k3*rate.c_uptrend)/found:0;
   k2=(found>0)?(m_k1*rate.a_dntrend+m_k2*rate.b_dntrend+m_k3*rate.c_dntrend)/found:0;
//---
   table.AddRow(row);
   table.SetValue(0,row,pattern_name);
   table.SetValue(1,row,(string)found);
   table.SetValue(2,row,TimeframeToString(timeframe));
   table.SetValue(3,row,DoubleToString(p1,2),2);
   table.SetValue(4,row,DoubleToString(p2,2),2);
   table.SetValue(5,row,DoubleToString(k1,2),2);
   table.SetValue(6,row,DoubleToString(k2,2),2);
   ZeroMemory(rate);
   m_total_row++;
  }
To eliminate potential questions related to using the application, the video below shows examples of calculations with different settings.
Recommendations for testing Merrill patterns:
- To allow the application work correctly, we need historical data for testing on a specified trading symbol to be downloaded.
- It is not recommended to download all patterns and all timeframes at the same time, since handling the results may take a long time.
- The most common scenarios that may cause difficulties are accompanied by tips. Such scenarios include not setting a timeframe or a pattern, as well as invalid date.
- Be careful when setting EA properties (Fig. 6). If the settings are not clear, re-read the article.
- The article has covered the topic of a pattern efficiency calculation method twice. The link to the article dwelling on the topic has been provided. Keep in mind that you need clear understanding of how the weighting coefficients in the settings tab affect the patterns evaluation.
Conclusion
The archive attached below contains all described files arranged into appropriate folders. For correct operation, place the MQL5 folder to the terminal's root directory. To open the terminal root directory, in which the MQL5 folder is located, press the Ctrl+Shift+D key combination in the MetaTrader 5 terminal or use the context menu as shown in Fig. 7 below.
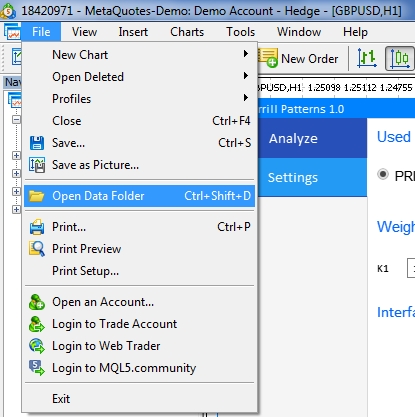
Fig. 7. Opening the MQL5 folder in the MetaTrader 5 terminal root
Translated from Russian by MetaQuotes Ltd.
Original article: https://www.mql5.com/ru/articles/7022
Warning: All rights to these materials are reserved by MetaQuotes Ltd. Copying or reprinting of these materials in whole or in part is prohibited.
This article was written by a user of the site and reflects their personal views. MetaQuotes Ltd is not responsible for the accuracy of the information presented, nor for any consequences resulting from the use of the solutions, strategies or recommendations described.

 A New Approach to Interpreting Classic and Hidden Divergence. Part II
- Free trading apps
- Over 8,000 signals for copying
- Economic news for exploring financial markets
You agree to website policy and terms of use
Interesting article(!) but haven't you run at least a basic test of the performance of the patterns and share it here like: timeframe, timespan, found, threshold, how often threshold touched?
What's the point of this? There are a lot of configuration options. Everyone can choose something of their own.
Hello.
I am interested in the chart pattern.
I downloaded the zip and wanted to test it, but I couldn't get it running as I wanted, so I was wondering if you could tell me how to use it in detail?
How do I open the Advisor and start the main screen?
When I drop a file onto the chart, the main screen does not appear.
I also pay attention to previous highs and lows. I want to determine the previous high and low at the point of the chart pattern and give the probability of the movement of the next leg if it is associated with resistance or support.
For example, if the first and fourth points in M2 are resistance, the first = resistance is reached, the second = a new high is reached, the third = the new high is pushed back by a profit-taking sell-off or a stop-loss sell-off at a limit price, the fourth = the price rises to resistance, but the buy-sell equilibrium is reached, the fifth = no further rise is expected. The fifth = The market decided that no further rise could be expected, and the price fell. We would like to incorporate resistance and support into our thinking.
If possible, could you give us some ideas?
Thank you in advance.
I don't know how to correct this.
Regards
Hi Alex,
What a great article and i'm interesting to try it.
I opened the your project in MQL5 editor.
I have placed all the files on the location and run the program. found below errors
resource file '\Images\EasyAndFastGUI\Candles\passive_2.bmp' not found MainWindow.mqh 1244 11

resource file '\Images\EasyAndFastGUI\Candles\pressed_2.bmp' not found MainWindow.mqh 1245 11
'iATR' - wrong parameters count MainWindow.mqh 850 14
3 errors and 18 warnings. is anything missing?