
Patterns available when trading currency baskets

Introduction
My previous article on trading currency baskets dwelt on its basic principles, approaches and terminology. Of course, this is not enough for successfully following this complex method. Understanding entry and exit conditions, as well as signals remains crucial. In other words, we need descriptions of the currently known patterns that can significantly increase the profitability. This will be the objective of the article — provide traders with a detailed description of the patterns formed when working with currency baskets. We are going to apply terminology as well as the descriptions of baskets and technical tools similar to the ones in the previous articles. We are also going to apply the combined Williams’ Percent Range (WPR) indicators to analyze currency basket status.
Let's characterize this indicator briefly. The parent WPR values change from 0% to -100%. This range is not suitable for us for the reasons provided below. The range of values from 100% to -100% with the transition through zero is required to display all patterns correctly. This change can easily be taken into account in the indicator code. Besides, we assume that existing oversold/overbought levels for the parent indicator remain relevant for the combined one, thus we are going to use them actively.
Dynamic entry features. Patterns #1, 2
The dynamic entry means entering the market when an indicator reaches a certain value used as an entry signal without waiting for the current candle to close. First, let's consider the pattern of a currency basket's considerable strengthening/weakening. From the market's point of view, this means the occurrence of one or more events bringing investors to buy or sell a certain currency and forcing it up or down relative to others. For example, the public appearances of the ECB chief Mario Draghi may easily strengthen or weaken EUR relative to other currencies. In such a case, the combined WPR approaches the upper or lower border of the range. A trader may enter the market after the indicator reaches a certain value without waiting for a candle to close performing a dynamic entry.
- Pattern #1
This pattern can often be found in numerous descriptions of standard technical indicators.
The indicator almost touches the border, then reverses and breaks the overbought line downwards or the oversold line upwards. This a trend-following entry signal on all currencies within the basket.
According to many authoritative sources, by no means such an entry should be performed dynamically. Therefore, I strongly do not recommend using the pattern #1 in trading.
- Pattern #2
The second pattern is a modified version of the previous one.
The indicator almost touches the range border and is about to reverse together with the current trend. This is a counter-trend entry signal on all currencies within the basket.
It would be incorrect to expect the imminent price reversal according to single indicator readings. However, keep in mind that the combined WPR is an oscillator that does not work in a trend. In the current situation, the indicator may hang around the range borders for quite a long time slightly deviating from them at one time and approaching them again afterwards. In the meantime, the current trend continues increasing trader's losses. Of course, this will finally end in a roll-back from the borders but it may take a while. No one can guarantee that the drawdown will remain bearable, and the financial results may be devastating.
However, some traders use this pattern when the indicator shows values significantly higher than 90% or less than -90%. The reason is that the pattern #2 also has a notable advantage allowing traders to capture a trend at its very beginning. Apparently, we need some additional entry signals. We can search for them using Price Action.
Besides, it is advisable not to trade this pattern if it is formed by a newly arrived fundamental news. Instead, the pattern is more reliable in the already formed trend as it may hint at its incoming end.
As an example, we can use the CHF price history during the black swan event in mid-January 2015. The history monitoring is attached in CSV files (MS Excel). The file names correspond to the monitoring starting date and time. The files contain four data columns:
| Monitoring time | H1 indicator readings | H4 indicator readings | D1 indicator readings |
|---|---|---|---|
| ... | ... | ... | ... |
| 12:51:32 | 99.16 | 99.17 | 99.17 |
| 12:51:34 | 98.85 | 98.87 | 98.88 |
| ... | ... | ... | ... |
There you can see how lower-timeframe data change compared to the higher-timeframe ones and how the indicator readings almost reach the range borders deviating and approaching again. Anyone who dared to enter the market at such a moment, would certainly get a quick stop loss.
Of course, it is possible to find contrasting examples on the charts when a dynamic entry brings a handsome profit. However, the large probability of failure makes the pattern #2 too risky. Therefore, I do not recommend it either.
Entry at the bar's closing. Pattern #3
A trader receives an entry signal on all currency pairs of a basket if an overbought level is crossed downwards or an oversold one is crossed upwards by the combined WPR after the current timeframe's candle is closed.
This market entry method is widely known for certain currency pairs. However, if we keep in mind that combined indicators inherit the properties of the parent ones as specified in the previous article, the entry on oversold/overbought levels' breakthrough can be assumed valid when dealing with currency pair baskets as well. Besides, since a level breakthrough follows the indicator reversal near the range borders (which implies the presence of some, albeit short, movement), the entry follows the trend. The main condition of the pattern #3 is to identify a trend after the current timeframe candle is closed.
The entry itself is performed in a standard way. Traders may follow the market or use limit orders. However, in the second case, the entry may not occur on all currency pairs. This may in turn lead to an overall loss for the entire basket buy/sell operation. Let's illustrate this using the following example.
A trader enters the market at all basket's currency pairs keeping in mind that not all pairs may eventually be profitable. Some pairs may show a zero result, while some may be at a loss if the local news turn out to be mostly negative. Suppose that EURJPY chart is mostly bearish for quite a while already due to problems in the euro area and bad statistics. Thus, the combined WPR line for the EUR baskets goes downwards and start approaching the range boundary. At this moment, the market sentiment changes, statistics become more favorable and investors' confidence is restored. EURJPY movement becomes flat and the bullish movement seems unavoidable. The combined WPR line reverses and crosses the oversold line. The trader follows the signal and enters the market buying the EUR basket. But for some reason, the EURJPY chart still remains flat and even leans towards the bearish movement again.
Why? Because the good news about EUR have been followed by the good news about JPY. Therefore, investors have started buying JPY pushing it upwards as well (may be even faster than EUR), hence the flat and even bearish movement. Thus, the trader's expectations concerning this pair have turned out to be wrong. But the basket has other pairs with no fresh statistics for them at all. They have yielded profit. But if the trader have been used limit orders to buy the EUR basket, the situation may have turned out to be even less favorable, since not all currency pairs could have been triggered during the entry. Moreover, only one pair (EURJPY) could have been triggered at all causing a loss.
Let's consider an example from the actual practice. Let's use the same pair EURJPY and launch the testWPR.mq5 test indicator on H1:
//| testWPR.mq5 |
//| MetaQuotes Software Corp. |
//| http://fxstill.com |
//+------------------------------------------------------------------+
#property copyright "Copyright 2016, MetaQuotes Software Corp."
#property link "http://www.mql5.com"
#property version "1.00"
#property indicator_separate_window
#property indicator_minimum -100
#property indicator_maximum 100
#property indicator_buffers 1
#property indicator_plots 1
input int WPR=14; //Period WRP
input color clr= clrBlue;
#define LG 7
string pair[]={"EURUSD","EURJPY","EURCHF","EURGBP","EURNZD","EURCAD","EURAUD"};
int h[LG];
double ind[];
//+------------------------------------------------------------------+
//| Custom indicator initialization function |
//+------------------------------------------------------------------+
int OnInit()
{
//--- indicator buffers mapping
for(int i=0; i<LG; i++)
{
h[i]=iWPR(pair[i],0,WPR);
}
ArraySetAsSeries(ind,true);
SetIndexBuffer(0,ind);
IndicatorSetString(INDICATOR_SHORTNAME,"testWPR");
IndicatorSetInteger(INDICATOR_DIGITS,2);
IndicatorSetInteger(INDICATOR_LEVELS,2);
IndicatorSetInteger(INDICATOR_LEVELSTYLE,0,STYLE_SOLID);
IndicatorSetInteger(INDICATOR_LEVELSTYLE,1,STYLE_SOLID);
IndicatorSetInteger(INDICATOR_LEVELCOLOR,0,clrRed);
IndicatorSetInteger(INDICATOR_LEVELCOLOR,1,clrRed);
IndicatorSetInteger(INDICATOR_LEVELWIDTH,0,1);
IndicatorSetInteger(INDICATOR_LEVELWIDTH,1,1);
IndicatorSetDouble(INDICATOR_LEVELVALUE,0,-60);
IndicatorSetDouble(INDICATOR_LEVELVALUE,1,60);
PlotIndexSetInteger(0,PLOT_DRAW_TYPE,DRAW_LINE);
PlotIndexSetInteger(0,PLOT_LINE_STYLE,STYLE_SOLID);
PlotIndexSetInteger(0,PLOT_LINE_WIDTH,2);
PlotIndexSetInteger(0,PLOT_LINE_COLOR,clr);
PlotIndexSetString(0,PLOT_LABEL,"_tstWPR_");
//---
return(INIT_SUCCEEDED);
}
//+------------------------------------------------------------------+
//| |
//+------------------------------------------------------------------+
double GetValue(int shift)
{
double dBuf[1];
double res=0.0;
for(int i=0; i<LG; i++)
{
CopyBuffer(h[i],0,shift,1,dBuf);
res+=dBuf[0];
}//end for (int i = 0; i < iCount; i++)
res=res/LG;
return (NormalizeDouble((res + 50) * 2, _Digits) );
}
//+------------------------------------------------------------------+
//| Custom indicator iteration function |
//+------------------------------------------------------------------+
int OnCalculate(const int rates_total,
const int prev_calculated,
const datetime &time[],
const double &open[],
const double &high[],
const double &low[],
const double &close[],
const long &tick_volume[],
const long &volume[],
const int &spread[])
{
//---
if(prev_calculated==0 || rates_total>prev_calculated+1)
{
int rt=rates_total-WPR;
for(int i=1; i<rt; i++)
{
ind[i]= GetValue(i);
}
}
else
{
}
//--- return value of prev_calculated for next call
return(rates_total);
}
//+------------------------------------------------------------------+
void OnDeinit(const int reason)
{
for(int i=0; i<LG; i++)
{
if(h[i]!=INVALID_HANDLE) IndicatorRelease(h[i]);
}
string text;
switch(reason)
{
case REASON_PROGRAM:
text="Indicator terminated its operation by calling the ExpertRemove() function";break;
case REASON_INITFAILED:
text="This value means that OnInit() handler "+__FILE__+" has returned a nonzero value";break;
case REASON_CLOSE:
text="Terminal has been closed"; break;
case REASON_ACCOUNT:
text="Account was changed";break;
case REASON_CHARTCHANGE:
text="Symbol or timeframe was changed";break;
case REASON_CHARTCLOSE:
text="Chart was closed";break;
case REASON_PARAMETERS:
text="Input-parameter was changed";break;
case REASON_RECOMPILE:
text="Program "+__FILE__+" was recompiled";break;
case REASON_REMOVE:
text="Program "+__FILE__+" was removed from chart";break;
case REASON_TEMPLATE:
text="New template was applied to chart";break;
default:text="Another reason";
}
PrintFormat("%s",text);
}
//+------------------------------------------------------------------+
Since the range of the combined WPR is from -100% to 100%, the overbought level is located at 60%, instead of the parent WPR's -20%. Thus, the oversold level is at -60%, instead of -80%. Keeping this in mind, let's mark these levels on the indicator chart.
We should analyze the overbought/oversold levels crossing point. At the time of this writing, it is located at the closing of a three-hour candle 17.10.2016 on H1:
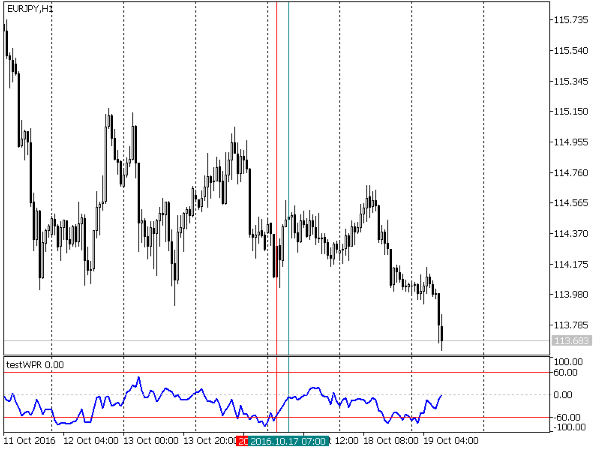
Let's assume that we entered the market at that moment. We should define the exit point beforehand. We are going to exit the market when the indicator value approaches or touches the zero level regardless of the trading results. This moment will come at seven o'clock in the morning of the same day. Let's mark the both points with vertical lines. The screenshots for other currency pairs within the EUR basket can be found in the archive attached below with the already marked lines. Note that EURNZD shows the negative result, EURGBP shows approximately the zero one, while the remaining five pairs are profitable.
However, there is a question of whether the oversold and overbought levels are correct. While comparing the standard and combined Stochastic indicator charts in the previous article, it became clear that the combined one is smoother. The same thing can be seen when comparing the standard and combined WPR (see the screenshot below):
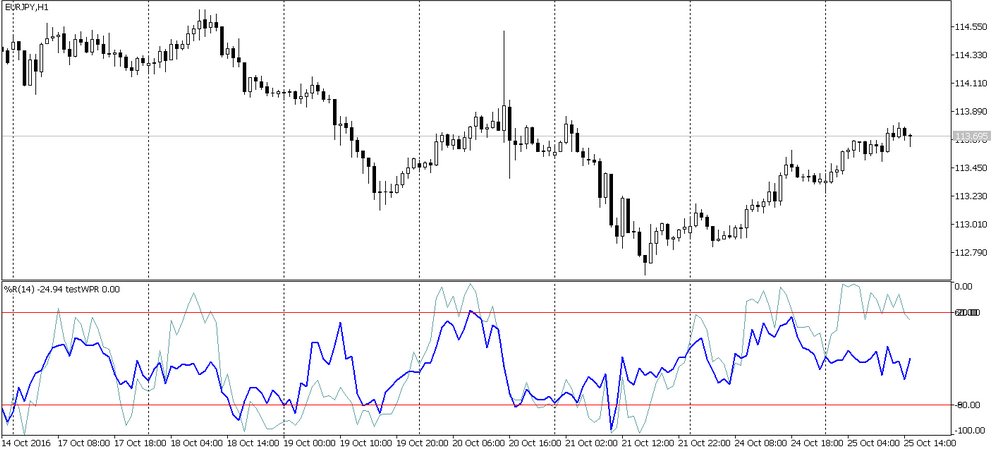
Here we have the graphs of the combined (thick blue line) and standard (thin blue line) WPRs.
Will the values of the overbought/oversold levels of the combined indicators remain unchanged as compared to the parent ones? To answer this question, we need to conduct an extensive research to find some hard evidence. Within the frames of the present article, we are only able to make very rough (primarily visual) estimations. To avoid subjective judgments, it seems inappropriate to give personal views on this subject here.
There is one more question about this pattern (and some others). What are the market exit conditions? We can offer two answers to this question:
- Exit the market on different currency pairs independently according to the Price Action rules. This allows you to use already familiar tools and the trailing stop. But this is risky since the basket may not be closed completely and the opened orders may finally cause losses exceeding the obtained profit. Of course, a trader is solely responsible for preventing that.
- Exit the market from all pairs at once according to the indicator readings. For example, a trader may buy a basket after the overbought level (-60%) is crossed and sell it when the indicator reaches zero (or -10%). In this case, the basket is completely closed though not all expected profit may be received.
Let's sum up the results of analyzing the pattern #3:
- The pattern can be applied in trading. It is defined after a candle closing and identified by levels. Crossing these levels serves as a possible entry signal.
- The pattern does not have some strictly defined entry and exit rules. However, the presence of the oversold and overbought levels defining the market entry signal is beyond doubt.
- The pattern allows for a significant drawdown.
- The pattern does not consider the existence of a second currency in every pair. This is the most significant drawback that may cause long-time drawdowns, as well as losses.
- There is also another drawback which is implicit but no less significant. As we have mentioned earlier, we may expect negative, zero and positive results when dealing with currency pair baskets. Traders receive profit because the status of a basket's pair shows the most promising direction increasing the probability of reaching a positive result on the most pairs within the basket. At this stage, the trading results may be negatively affected by swap, commissions and different point prices of various currency pairs.
Are we able to improve the pattern efficiency, reduce the drawdowns and increase profitability? It turns out that we are: let's pass to the next pattern.
Entry at the moment one currency is strengthening while another is weakening. Pattern #4
Unlike the previous pattern, this one takes into account that two currencies form the price.
For example, the price may move downwards in three cases for EURJPY:
- The first currency becomes stronger — EUR. This relates to the already described pattern #3 with all its drawbacks and benefits.
- The second currency becomes weaker — JPY. This also relates to the pattern #3.
- EUR is strengthening and JPY is weakening simultaneously. This event increases the probability of a reversal and moving in a favorable direction. The probability increases while the currencies go on strengthening and weakening.
The pattern #4 provides a market entry signal defining the situation described in the third point. This occurs as follows.
Each pair consists of two currencies potentially belonging to two different baskets. For example, EURJPY may be analyzed using the two combined indicators with one of them based on EUR, while another being based on JPY. Thus, it is possible to manage strengthening/weakening of each of the two currencies. Moreover, it is possible to identify the pattern #3 as well, although #4 is the most important.
It is identified by analyzing the graph of a difference between the combined indicator readings for a base currency and a quote currency. While this difference remains approximately 0%, the market is flat since both currencies forming the pair are of approximately equal power. Investors trust both currencies, the news are mostly neutral and there are no sharp movements. Therefore, the combined indicator provides similar values for each currency, and the difference between them is small. It seems reasonable not to enter the market at this time.
But the situation starts changing. JPY is becoming stronger, while EUR is weakening. This continues for a certain time meaning that this is a trend rather than a one-time movement. A trader notices that the combined indicators' readings are changing. EUR readings are gradually moving to a negative area approaching the range borders. JPY is showing the opposite movement. EURJPY chart is leaning towards sells. Now, the trader examines the graph of the difference between the combined indicators for EUR and JPY. It moves downwards aiming for its minimum value of -200%.
In case of an opposite movement, the maximum value is 200%. I believe, it is clear now why we need to alter the combined WPR range so that it changes from 100% to -100% I have mentioned that at the beginning of the article. This allows us to place the graphs of the combined indicators and the difference between them in a single window. In order to get rid of the "inelegant" value of 200%, the difference between the two combined indicators should be divided in half bringing it to 100%.
Thus, the trader receives an entry signal when the difference between the readings of the combined indicators reaches a certain value. More specifically, the trader waits till the difference graph approaches one of the range borders, reverses and breaks the oversold line downwards or the overbought line upwards. The breakthrough should be assumed to occur on a candle closing. In other words, the strategy is similar to the one in the pattern #3, though with some differences:
- Two combined indicators defining the status of each currency within a pair to make a trading decision increasing the potential profitability.
- A market entry is performed on a single pair within the basket (not all). Thus, we manage to reduce the drawdown.
Let's examine using the pattern #4 in practice. To do this, we should create yet another indicator for the JPY basket. We will develop it the same way as testWPR. The list of the JPY basket currency pair is to be taken from the previous article. Since the indicator code is similar to testWPR one, there is no point in showing it here. The compiled indicator code is attached to the article. We only need to change the indicator color to red and place it on EURJPY to the same window where testWPR is already present. The result is shown below:
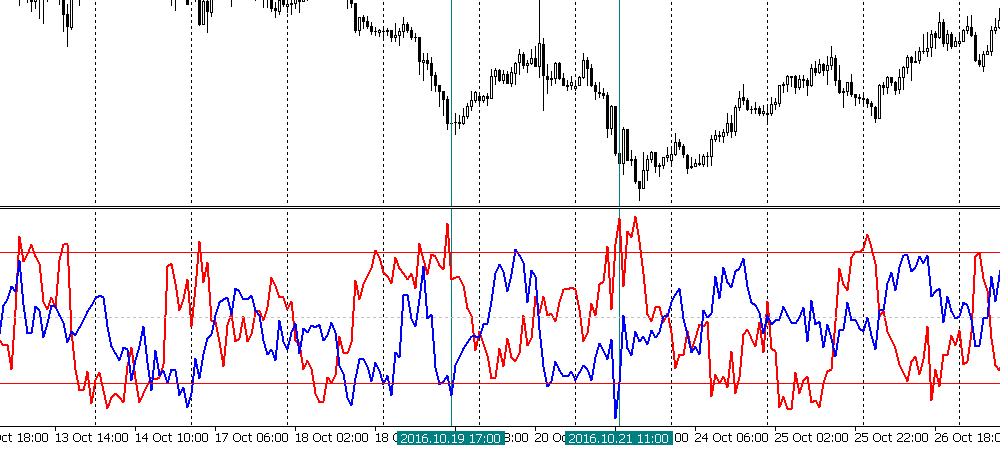
Points of interest are noted by vertical lines. Even such a small fragment allows us to see the correlation between the price chart and the difference between the indicators (the distance between the weakest and the strongest currencies).
However, it is difficult to track the desired difference on such a chart. Let's write yet another test indicator testDistance.mq5:
//| testDistance.mq5 |
//| 2016 MetaQuotes Software Corp. |
//| http://www.mql5.com |
//+------------------------------------------------------------------+
#property copyright "Copyright 2016, MetaQuotes Software Corp."
#property link "http://www.mql5.com"
#property version "1.00"
#property indicator_separate_window
#property indicator_minimum -100
#property indicator_maximum 100
#property indicator_buffers 1
#property indicator_plots 1
input int WPR = 14;//Period WPR
input color clr= clrGreen;
double ind[];
//+------------------------------------------------------------------+
//| Custom indicator initialization function |
//+------------------------------------------------------------------+
int h,h1;
int OnInit()
{
//--- indicator buffers mapping
h = iCustom(NULL,0,"testWPR",WPR);
if (h == INVALID_HANDLE) {
Print("Error while creating testWPR");
return (INIT_FAILED);
}
h1 = iCustom(NULL,0,"testWPRjpy",WPR);
if (h1 == INVALID_HANDLE) {
Print("Error while creating testWPRjpy");
return (INIT_FAILED);
}
ArraySetAsSeries(ind,true);
SetIndexBuffer(0,ind);
IndicatorSetString(INDICATOR_SHORTNAME,"testWPRdistance");
IndicatorSetInteger(INDICATOR_DIGITS,2);
IndicatorSetInteger(INDICATOR_LEVELS,2);
IndicatorSetInteger(INDICATOR_LEVELSTYLE,0,STYLE_SOLID);
IndicatorSetInteger(INDICATOR_LEVELSTYLE,1,STYLE_SOLID);
IndicatorSetInteger(INDICATOR_LEVELCOLOR,0,clrRed);
IndicatorSetInteger(INDICATOR_LEVELCOLOR,1,clrRed);
IndicatorSetInteger(INDICATOR_LEVELWIDTH,0,1);
IndicatorSetInteger(INDICATOR_LEVELWIDTH,1,1);
IndicatorSetDouble(INDICATOR_LEVELVALUE,0,-60);
IndicatorSetDouble(INDICATOR_LEVELVALUE,1,60);
PlotIndexSetInteger(0,PLOT_DRAW_TYPE,DRAW_LINE);
PlotIndexSetInteger(0,PLOT_LINE_STYLE,STYLE_SOLID);
PlotIndexSetInteger(0,PLOT_LINE_WIDTH,2);
PlotIndexSetInteger(0,PLOT_LINE_COLOR,clr);
PlotIndexSetString(0,PLOT_LABEL,"_tstWPRdistance_");
//---
return(INIT_SUCCEEDED);
}
double GetValue(int shift)
{
double dBuf[1], dBuf1[1];
double res=0.0;
CopyBuffer(h,0,shift,1,dBuf);
CopyBuffer(h1,0,shift,1,dBuf1);
return (NormalizeDouble((dBuf[0] - dBuf1[0])/2, _Digits) );
}
//+------------------------------------------------------------------+
//| Custom indicator iteration function |
//+------------------------------------------------------------------+
int OnCalculate(const int rates_total,
const int prev_calculated,
const datetime &time[],
const double &open[],
const double &high[],
const double &low[],
const double &close[],
const long &tick_volume[],
const long &volume[],
const int &spread[])
{
if(prev_calculated==0 || rates_total>prev_calculated+1)
{
int rt=rates_total-WPR;
for(int i=1; i<rt; i++)
{
ind[i]= GetValue(i);
}
}
else
{
}
//--- return value of prev_calculated for next call
return(rates_total);
}
void OnDeinit(const int reason)
{
IndicatorRelease(h);
IndicatorRelease(h1);
}
//+------------------------------------------------------------------+
Place it to a separate window on EURJPY and examine the previously marked area:
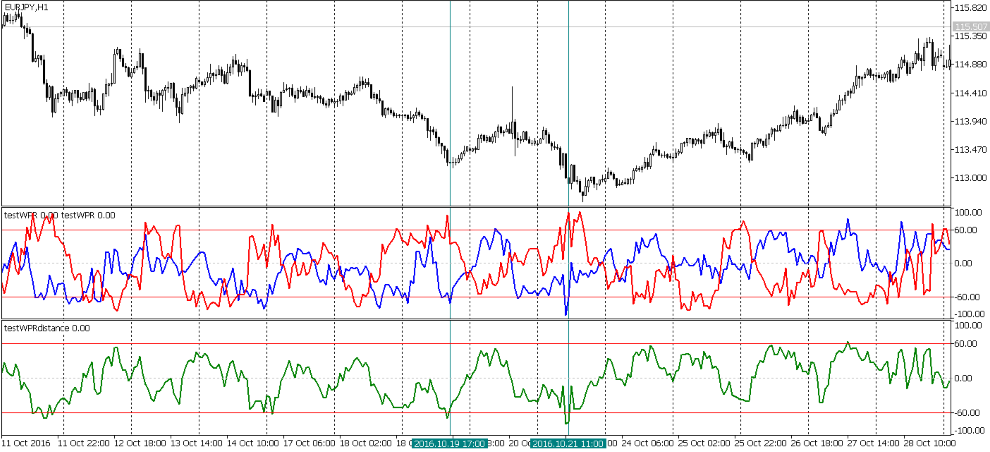
The difference between the two combined WPRs for EUR and JPY are shown as the green line. It would be interesting to examine how the difference between a strong currency and a weak one is related to the current trend and its reversals. Here we can also talk about overbought/oversold areas as well as about identifying the pattern #4 on a candle closing after the areas have been crossed (see the last screenshot). In this case, if a trader had entered the market on October 21 (at 11:00), they would have been able to capture the start of the trend that has not ended so far (November 1).
Thus, working with the pattern #4 at the implementation stage is similar to working with a common order rather than a basket of orders like in the case of the Pattern #3. Therefore, we can expect a significant reduction in the drawdown. We can also expect a rise in the number of profitable trades (but not in their total number) since the pattern #4 increases the probability of profit. Keep in mind that we can apply the trailing stop and use other tools we are used to since there is only one order and it can be tracked the usual way.
The pattern #4 can be also potentially applied as a filter together with the pattern #3. The market entry can be performed on all pairs of the basket according to the pattern #3, while the filter based on the pattern #4 is able to sort out some of them. Thus, it is possible to approach the third pattern's total profitability on several pairs, while maintaining the advantages of the fourth one. However, this is only my theory. I have not tested the combination of the patterns in real trading.
Now, let's describe situations when the pattern #4 gives false signals. These are quite clear situations when the movement of the combined indicator towards the range borders and subsequent reversals occur at the expense of other currency pairs, while the pair, at which a trader is about to enter the market, stands still. We should understand that a basket contains multiple pairs, and the combined indicator shows an average value. Local events may negatively affect the pair, at which a trader has entered the market. I have already mentioned that when describing the pattern #3. This is also true for the pattern #4, although the probability is much lower.
Let's summarize our data on the pattern #4.
Advantages:
- Increased probability of profit.
- Reduced drawdown.
- It is likely that the planned profit is to be achieved in less time. Perhaps, this is not an entirely separate advantage, but rather a complement to the first one.
- Traders do not have to deal with a basket of orders, instead they trade a single order. Therefore, tracking a trade is simple.
Drawbacks:
- The conditions suitable for identifying the pattern #4 are not very common.
- Lesser total profit, since only a single order is profitable.
Let's try to reduce the negative effects of the fourth pattern's drawbacks. To do this, we should define whether there are ways to increase the number of trades when one currency is severely weakened while another one is too strong other than using the pattern #4. Perhaps, there is another way to enter the market in addition to the overbought/oversold levels' breakthrough:
Entry considering the moving average. Pattern #5
Moving average is a recognized and respected method of market analysis. Many indicators and EAs use it in their calculations. We assume that the overbought/oversold levels work in the combined WPR. The same is true for the difference between the two combined WPRs. Therefore, nothing prevents us from adding a moving average to the indicator graphs as well.
Obviously, we can add it to the third and fourth patterns detection graphs. I believe, there is no point in describing the idea behind the moving average. Its advantages and drawbacks (including its lagging nature) are well-known as well. Taking all that into account, we are able to analyze the results of placing the moving average on the graphs in order to find the pattern #5:
A trader receives an entry signal when the indicator graph crosses the moving average. This event is assumed to have happened when the current timeframe's candle is closed.
Such crossings are quite often especially if we use the fast MA, therefore the number of trades increases. From now on, we are going to analyze the MA located on the fourth pattern detection graph. Readers may analyze the application of the MA on the third pattern detection one.
You may ask: Is it correct to call the MA application a separate pattern? Isn't it just an additional filter for the pattern #4? No, it is a separate pattern. Sometimes, the overbought/oversold levels are broken almost simultaneously with the indicator graph crossing the MA. In this case, the patterns #4 and 5 reinforce each other making it impossible to define "the most important" of them. In other cases, the pattern #4 is an independent pattern having nothing to do with the graph crossing the MA (pattern #5).
Anyway, let's introduce some rules:
- If the pattern #5 "precedes" the pattern #4 (i.e., it is identified between the range border and an oversold/overbought level), it is not traded.
- In other cases, a market entry decision is made regardless of whether the pattern#4 preceded the pattern #5 or not.
The second rule should be examined more thoroughly. In order to analyze possible situations with the pattern #5, we should create a new indicator (the last one in this article):
//| testDistance.mq5 |
//| 2016 MetaQuotes Software Corp. |
//| http://www.mql5.com |
//+------------------------------------------------------------------+
#property copyright "Copyright 2016, MetaQuotes Software Corp."
#property link "http://www.mql5.com"
#property version "1.00"
#property indicator_separate_window
#property indicator_minimum -100
#property indicator_maximum 100
#property indicator_buffers 2
#property indicator_plots 2
input int WPR = 14; //Period WPR
input int maperiod = 10; //Period MA
input color clr = clrGreen;
input color clrMA = clrMagenta;
double ind[],ma[];
//+------------------------------------------------------------------+
//| Custom indicator initialization function |
//+------------------------------------------------------------------+
int h,h1;
int OnInit()
{
//--- indicator buffers mapping
h = iCustom(NULL,0,"testWPR",WPR);
if (h == INVALID_HANDLE) {
Print("Error while creating testWPR");
return (INIT_FAILED);
}
h1 = iCustom(NULL,0,"testWPRjpy",WPR);
if (h1 == INVALID_HANDLE) {
Print("Error while creating testWPRjpy");
return (INIT_FAILED);
}
ArraySetAsSeries(ind,true);
SetIndexBuffer(0,ind);
IndicatorSetString(INDICATOR_SHORTNAME,"testWPRdistance");
IndicatorSetInteger(INDICATOR_DIGITS,2);
IndicatorSetInteger(INDICATOR_LEVELS,2);
IndicatorSetInteger(INDICATOR_LEVELSTYLE,0,STYLE_SOLID);
IndicatorSetInteger(INDICATOR_LEVELSTYLE,1,STYLE_SOLID);
IndicatorSetInteger(INDICATOR_LEVELCOLOR,0,clrRed);
IndicatorSetInteger(INDICATOR_LEVELCOLOR,1,clrRed);
IndicatorSetInteger(INDICATOR_LEVELWIDTH,0,1);
IndicatorSetInteger(INDICATOR_LEVELWIDTH,1,1);
IndicatorSetDouble(INDICATOR_LEVELVALUE,0,-60);
IndicatorSetDouble(INDICATOR_LEVELVALUE,1,60);
PlotIndexSetInteger(0,PLOT_DRAW_TYPE,DRAW_LINE);
PlotIndexSetInteger(0,PLOT_LINE_STYLE,STYLE_SOLID);
PlotIndexSetInteger(0,PLOT_LINE_WIDTH,2);
PlotIndexSetInteger(0,PLOT_LINE_COLOR,clr);
PlotIndexSetString(0,PLOT_LABEL,"_tstWPRdistance_");
ArraySetAsSeries(ma,true);
SetIndexBuffer(1,ma);
PlotIndexSetInteger(1, PLOT_DRAW_TYPE, DRAW_LINE );
PlotIndexSetInteger(1, PLOT_LINE_STYLE, STYLE_SOLID );
PlotIndexSetInteger(1, PLOT_LINE_WIDTH, 1 );
PlotIndexSetInteger(1, PLOT_LINE_COLOR, clrMA );
PlotIndexSetString (1, PLOT_LABEL, "Middle_Basket_line_MA" );
//---
return(INIT_SUCCEEDED);
}
double GetValue(int shift)
{
double dBuf[1], dBuf1[1];
double res=0.0;
CopyBuffer(h,0,shift,1,dBuf);
CopyBuffer(h1,0,shift,1,dBuf1);
return (NormalizeDouble((dBuf[0] - dBuf1[0])/2, _Digits) );
}
//+------------------------------------------------------------------+
//| Custom indicator iteration function |
//+------------------------------------------------------------------+
int OnCalculate(const int rates_total,
const int prev_calculated,
const datetime &time[],
const double &open[],
const double &high[],
const double &low[],
const double &close[],
const long &tick_volume[],
const long &volume[],
const int &spread[])
{
if(prev_calculated==0 || rates_total>prev_calculated+1)
{
int rt=rates_total-WPR;//-maperiod;
for(int i=1; i<rt; i++)
{
ind[i]= GetValue(i);
}
rt -= maperiod;
for (int i = 1; i< rt; i++)
{
ma[i] = GetMA(ind, i, maperiod, _Digits);
}
}
else
{
}
//--- return value of prev_calculated for next call
return(rates_total);
}
void OnDeinit(const int reason)
{
IndicatorRelease(h);
IndicatorRelease(h1);
string text;
switch(reason)
{
case REASON_PROGRAM:
text="Indicator terminated its operation by calling the ExpertRemove() function";break;
case REASON_INITFAILED:
text="This value means that OnInit() handler "+__FILE__+" has returned a nonzero value";break;
case REASON_CLOSE:
text="Terminal has been closed"; break;
case REASON_ACCOUNT:
text="Account was changed";break;
case REASON_CHARTCHANGE:
text="Symbol or timeframe was changed";break;
case REASON_CHARTCLOSE:
text="Chart was closed";break;
case REASON_PARAMETERS:
text="Input-parameter was changed";break;
case REASON_RECOMPILE:
text="Program "+__FILE__+" was recompiled";break;
case REASON_REMOVE:
text="Program "+__FILE__+" was removed from chart";break;
case REASON_TEMPLATE:
text="New template was applied to chart";break;
default:text="Another reason";
}
PrintFormat("%s",text);
}
//+------------------------------------------------------------------+
double GetMA(const double& arr[], int index , int period, int digit) {
double m = 0;
for (int j = 0; j < period; j++) m += arr[index + j];
m /= period;
return (NormalizeDouble(m,digit));
}
Let's place the indicator on the same symbols. The results are provided below:
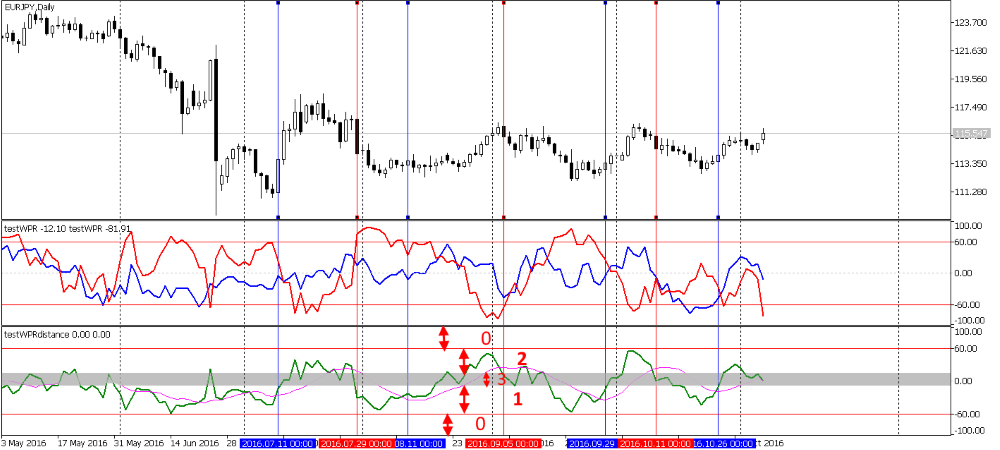
Here, the moving average is shown as a thin crimson line. Some segments that can be identified as the ones containing the pattern #5 are marked by vertical lines. Blue lines stand for a buy signal, while red ones mark a sell signal. We can easily see that some points where the difference graph crosses the MA are not marked. Let's explain this keeping the previously introduced rules in mind.
We should divide the entire indicator range into several areas and set the final rules for the pattern #5:
- If MA/indicator graph crossing occurs at some point between the indicator border and oversold/overbought area, the signal is ignored. These points are the Zone #0 (zero zones). There are two such zones (see the screenshot).
- As I have already mentioned, the patterns #4 and 5 may occur simultaneously reinforcing each other. If a trader identifies the pattern #4 (or #4 and 5) and enters the market, they should consider ignoring all subsequent patterns #5 till exiting the market using the pattern #4.
- Over time, a strong currency may weaken while a weak one may grow stronger, or the weak one may go on weakening while the strong one may start moving downwards as well, or both currencies may start growing stronger. In any case, the indicator graph will start moving away from the range borders and the overbought/oversold levels. The graph will move to the indicator's zero value meaning roughly equal strength of each currency. Thus, the current trend is coming to an end turning into a flat which may transform into a reversal and the cycle will be repeated. This is a market exit signal. Staying in the market when the powers of the both currencies become approximately equal is dangerous since the probability of a reversal is high. Let's call the zero zone the Zone #3. You can define its borders on your own, though I prefer the interval between 10% and -10%. All patterns #5 are ignored there, while the previously opened trades are considered to be closed (at least partially) or moved to a breakeven.
- Only two zones are suitable for trading when using the pattern #5:
- Zone #1 for buying. The appropriate trades are shown as the blue vertical lines on the last screenshot. The closer the pattern #5 is to the border between the zones #1 and 0, the greater the probability that trading the pattern brings profit.
- Zone #2 for selling. The appropriate trades are shown as the red vertical lines on the last screenshot. The closer the pattern is to the upper border of the zone #2, the higher the probability of profit.
Important general rule: Buy patterns #5 formed within the zone #2 are ignored. Sell patterns #5 formed within the zone #1 are ignored as well.
The pattern #5 has the same issue as the pattern #4:
- It may occur on the pair other than the one a trader is going to use to enter the market. In other words, the risk of a negative result remains though we considered all possible ways to minimize it.
Some general considerations
All described patterns have one thing in common: an overbought/oversold level breakthrough is considered to have occurred after the current timeframe's candle is closed. Suppose we want to fix an overbought level breakthrough. The level is located at 60% in the combined WPR window. The chart rises to 61.5% but then falls reaching 59% at the candle closing. Should we consider this as a breakthrough or not? Technically, the conditions are met. But is this microscopic pattern worth trading?
Another situation that occurs more often than you might expect: a candle with a big body is formed, and the indicator value at the candle closing is at the zero level or even near the range's opposite border. Again, the breakthrough is technically present, but is the pattern worth trading?
I believe, that we should trade only clearly visible patterns causing no doubts. This is similar to the rule applied when plotting support/resistance lines: the lines should be clear and indisputable. Speaking of the previous case, the breakthrough of the overbought level would have been considered to have occurred if the indicator value had decreased down to the levels of 45-55% from 70% or so. Besides, there is a possibility of moving towards the zero zone where you can close your position or make some other trading decision.
The same is true for the MA crossing the indicator graph. Such a crossing should occur in the necessary zone and be clear and noticeable, one might even say "beautiful". If the indicator graph starts moving near the MA crossing it slightly in one and then the other direction, consider skipping this pattern.
In other words, uncertain, controversial patterns should be considered as high-risk ones and skipped. Anyway, this is the author's personal opinion reflecting his view on the market. Thus, it cannot be regarded as an axiom.
Conclusion
All that has been written here using the example of the combined WPR indicator is also true for other combined indicators based on oscillators. This provides us with clear overbought/oversold levels retaining the oscillator limitations meaning that there may be other interesting tools that can be applied to trading currency pair baskets.
Translated from Russian by MetaQuotes Ltd.
Original article: https://www.mql5.com/ru/articles/2816
Warning: All rights to these materials are reserved by MetaQuotes Ltd. Copying or reprinting of these materials in whole or in part is prohibited.
This article was written by a user of the site and reflects their personal views. MetaQuotes Ltd is not responsible for the accuracy of the information presented, nor for any consequences resulting from the use of the solutions, strategies or recommendations described.

 Graphical Interfaces X: Time control, List of checkboxes control and table sorting (build 6)
 Statistical distributions in the form of histograms without indicator buffers and arrays
 An Example of Developing a Spread Strategy for Moscow Exchange Futures
 Graphical Interfaces X: Text Edit box, Picture Slider and simple controls (build 5)
- Free trading apps
- Over 8,000 signals for copying
- Economic news for exploring financial markets
You agree to website policy and terms of use
New article Patterns available when trading currency baskets has been published:
Author: Andrei Novichkov
Hi Andrei i am interested with this indicators. can you develop readily applicable for me for EUR/USD and
some other pairs?
Hi, kumarsk
Of course. WPR, or RSI, or STOCH for 28 pairs. Look at the image for an example (WPR).
The code is slightly different for each basket currency. For example, you want to buy a basket on USD. To do this, you should enter the sale on EURUSD, because USD is the "second" currency. It is written in detail in the first article (or in the second one, I don't remember exactly) on this topic. There is a table for all basket currencies. I would like to remind you that test indicators are not suitable for use in "real life".