Distributed Tracing for Expert Advisors: A Native OpenTelemetry (OTLP) Exporter in MQL5
 73
 0

Introduction
Most MQL5 monitoring stops at logs and the Strategy Tester report. That is fine for a single Expert Advisor sitting on one chart, but the moment a signal depends on something outside the terminal — a Python model, a risk service, a data feed — a log file on its own cannot show you where the time was spent or why a decision was made. You end up correlating timestamps by hand between two or three log files, which gets old fast once anything goes wrong at 3 a.m. on a live account.
This article builds a native OpenTelemetry (OTLP) tracer for MQL5: a clock, identifier generation, and an exporter. It then wires the tracer into an EMA-cross Expert Advisor that calls a small Python scoring service. Each bar cycle becomes a distributed trace. The EA's decision steps and the Python service's processing share the same trace ID, so Jaeger renders them as a single timeline.
MQL5 has no listening socket API — SocketConnect() can only dial out, so this tracer never tries to run an OTLP gRPC receiver inside the terminal. Everything here is a client: the EA formats OTLP/HTTP JSON payloads by hand and pushes them out with WebRequest(), the same call already used for REST integrations. Nothing about this design needs gRPC or a compiled protobuf library, both of which are unavailable in MQL5 anyway.
Three things make this harder than a typical logging wrapper: First, W3C trace context needs 128-bit trace IDs and 64-bit span IDs, and MathRand() only returns 15 bits per call — you cannot get there by calling it a few times and gluing the results together. Second, OTLP wants nanosecond timestamps, and MQL5's only wall-clock function, TimeGMT(), only resolves to the second. Third, a trace has to stay a valid tree even when a function returns early or an exception-like error path skips the code that would normally close a span — the RAII guard that handles this in MQL5 looks almost like C++, but the details of what "closing a span" quietly does by default matter more than they first appear to.
Architecture
The tracer sits in four layers, each in its own include file. OtelCore.mqh has no dependency on anything else — it is the clock, the identifier generator, the ratio sampler, and a handful of JSON-formatting helpers. OtelTracer.mqh builds on that: it defines a span object, a tracer that keeps a stack of open spans so parent-child relationships fall out automatically, and a scope guard that starts a span in its constructor and ends it in its destructor. OtlpExporter.mqh owns the network side — a bounded ring queue, OTLP/JSON batch assembly, and the actual WebRequest() calls with retry and backoff. The EA itself, OtelTraced_EA.mq5, only ever talks to the tracer through COtelScope objects; it never touches the exporter or the identifier generator directly.
A single bar cycle produces a tree, not a flat list. The root span, bar_cycle, wraps everything the EA does on a new bar: feature calculation, a local risk check, an optional call to the Python service, and the order itself. When the service is asked to confirm a signal, the EA attaches a W3C traceparent header to that HTTP request, built from the currently open span. The Python side reads that header, starts its own span as a child of it, and exports to the same collector — so two separate processes, in two different languages, end up in one trace with no coordination beyond that one header.
Component Layout and Span Tree
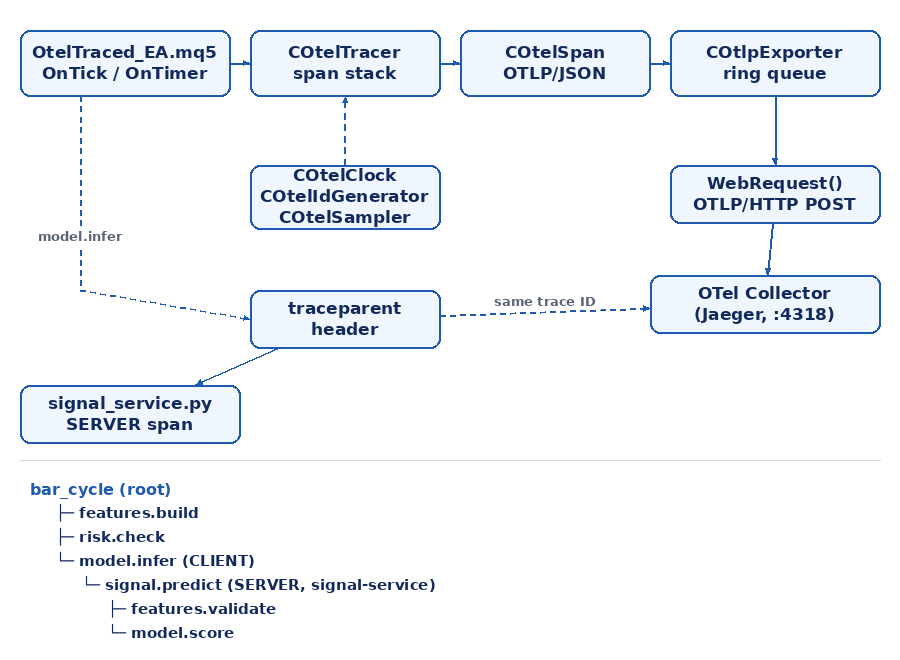
Fig. 1. The four include-file layers, the WebRequest path to the collector, the traceparent hop to the Python service, and the span tree one bar cycle produces.
Enqueuing a finished span never blocks: it only appends a string to a fixed-size array, which is why every scope guard can call it unconditionally, even deep inside the order-handling path. Delivery is different — WebRequest() is still a blocking call, and MQL5 runs one event handler at a time per chart, so while OnTimer() is waiting on a response, for up to InpTimeoutMs, a tick that arrives meanwhile is queued and only processed once OnTimer() returns. Keeping WebRequest() out of OnTick() does not eliminate the delay. It limits the impact to at most one timeout period per timer tick, instead of stalling every price update. If the collector is unreachable, the queue absorbs spans until it fills, at which point the oldest entry is silently overwritten rather than the call blocking further.
OtelCore.mqh: Clock, Identifiers, and the Sampler
COtelClock — anchoring nanoseconds to a second edge. OTLP timestamps are Unix nanoseconds, but the only wall-clock function MQL5 gives you, TimeGMT(), only resolves to whole seconds. GetMicrosecondCount() is a free-running microsecond counter with no relation to wall time at all. The clock's job is to pin these two together once, at startup, and derive every later timestamp from that single anchor.
//+------------------------------------------------------------------+
//| COtelClock                                                       |
//| Converts the monotonic microsecond counter into Unix-epoch       |
//| nanoseconds. TimeGMT() has one-second resolution, so the clock   |
//| pins the counter to a wall-clock second boundary once and        |
//| derives every later timestamp as anchor plus elapsed             |
//| microseconds.                                                    |
//|                                                                  |
//| Span durations stay sub-millisecond and can never run backwards, |
//| which repeated TimeGMT() reads could not guarantee.              |
//+------------------------------------------------------------------+
class COtelClock
  {
private:
//--- wall-clock second and counter value captured at the same instant
   ulong                m_anchor_sec;  // Unix seconds at the anchor instant
   ulong                m_anchor_mu;   // GetMicrosecondCount() at the anchor instant
   bool                 m_synced;      // true when a real second edge was observed
public:
                        COtelClock(void);
   bool                 Init(void);
   ulong                NowNanos(void) const;
   bool                 IsSynced(void) const;
  };
On a live terminal, Init() busy-waits for TimeGMT() to roll over, then reads the microsecond counter. The reads are close, but not instantaneous: there is an unmeasured gap between the actual second boundary and when the loop detects it, depending on the polling frequency. A plain Sleep() would make that gap worse, not fix it: the scheduler can delay a sleeping thread by ten milliseconds or more, baked into every timestamp for the rest of the run — so the busy-wait is the better of the two realistic options even though its own accuracy hasn't been independently measured here. It's also worth being precise about what NowNanos() delivers later: the clock is still built on a microsecond counter underneath, multiplied out to a nanosecond-shaped number — nanosecond formatting for the OTLP field, not a measurement taken at nanosecond resolution.
//+------------------------------------------------------------------+
//| COtelClock::Init                                                 |
//| Captures the anchor. In a live terminal the method spins until   |
//| TimeGMT() rolls over to the next second, then reads the          |
//| microsecond counter immediately, so the pair is aligned to       |
//| within a few microseconds. The spin is capped at                 |
//| OTEL_SYNC_MAX_US.                                                |
//|                                                                  |
//| In the Strategy Tester TimeGMT() is simulated time that never    |
//| rolls in real time, so the anchor is taken at once and the clock |
//| only provides correct durations there.                           |
//+------------------------------------------------------------------+
bool COtelClock::Init(void)
  {
//--- tester and optimizer: no real second edge to wait for
   if(MQLInfoInteger(MQL_TESTER)!=0 || MQLInfoInteger(MQL_OPTIMIZATION)!=0)
     {
      m_anchor_mu=GetMicrosecondCount();
      m_anchor_sec=(ulong)TimeGMT();
      m_synced=false;
      return(false);
     }
   const ulong started=GetMicrosecondCount();
   const datetime first=TimeGMT();
   bool edge=false;
//--- busy-wait: Sleep() would add up to 15 ms of scheduler jitter to the anchor
   while(GetMicrosecondCount()-started<=OTEL_SYNC_MAX_US)
     {
      if(TimeGMT()!=first)
        {
         edge=true;
         break;
        }
     }
//--- read the counter first, then the second: the counter was captured
//--- right after the edge, so both belong to the same instant
   m_anchor_mu=GetMicrosecondCount();
   m_anchor_sec=(ulong)TimeGMT();
   m_synced=edge;
   return(edge);
  }
The Strategy Tester runs on simulated time that does not advance between calls the way real wall-clock time does, so waiting for a second edge there would spin for the full timeout on every single run. The tester branch skips the wait and anchors immediately — durations inside one run are still correct, since they only depend on the microsecond counter's own progression, but the tester's absolute timestamps should not be read as real calendar time.
COtelIdGenerator — 128 bits from a 15-bit source. W3C trace context needs a 128-bit trace ID and a 64-bit span ID that are practically unique within this process, not cryptographically secret — a trace ID's job is to correlate telemetry, not to authenticate anything. MathRand() returns a value in [0, 32767] — 15 bits — so eight calls only give you 120 bits of raw randomness, and naively concatenating them would make every ID predictable from the previous one, since each draw comes from the same short-period generator.
The generator instead hashes a 48-byte buffer through SHA-256: a call counter, the microsecond counter, TimeGMT(), a per-process salt derived from the chart ID, and eight MathRand() draws. SHA-256's avalanche property means a one-bit change anywhere in that buffer flips roughly half the output bits, so any 8 or 16 bytes sliced from the digest are well spread across their range rather than clustering the way a naive concatenation would — a uniqueness and distribution property, not unpredictability in a security sense. Hashing adds no entropy beyond the input. MathRand(), ChartID(), and the clocks are not secure sources, so an observer who can infer them could reconstruct an ID. The chart-ID-derived salt keeps two EA instances on different charts from drawing the same sequence, since MathSrand() is seeded once per instance and MQL5 doesn't share that state across charts — the same mechanism also desynchronizes the retry jitter covered later in this section.
//+------------------------------------------------------------------+
//| COtelIdGenerator::Digest                                         |
//| Fills the hash buffer and returns its SHA-256 digest in hash[]   |
//| (32 bytes). Layout: bytes 0-7 counter, 8-15 microsecond counter, |
//| 16-23 wall-clock seconds, 24-31 salt, 32-47 eight MathRand()     |
//| draws. Returns false when CryptEncode() fails.                   |
//+------------------------------------------------------------------+
bool COtelIdGenerator::Digest(uchar &hash[])
  {
   uchar key[];
//--- the counter goes first: two calls inside the same microsecond
//--- still hash different input
   m_counter++;
   PutU64(0,m_counter);
//--- time material
   PutU64(8,GetMicrosecondCount());
   PutU64(16,(ulong)TimeGMT());
//--- salt: separates two EAs that share the same counter values
   PutU64(24,m_salt);
//--- each draw is only 15 bits wide, so on their own they could never
//--- fill 128 bits; hashed together with the rest they add fresh entropy
   for(int i=0;i<8;i++)
     {
      const ushort draw=(ushort)MathRand();
      m_buffer[32+2*i]=(uchar)(draw&0xFF);
      m_buffer[33+2*i]=(uchar)(draw>>8);
     }
//--- a plain hash needs no key, so the empty key array is intentional
   return(CryptEncode(CRYPT_HASH_SHA256,m_buffer,key,hash)==32);
  }
COtelSampler — a ratio decision every process can reach independently. With InpSampleRatio below 1.0, most traces should be discarded before they ever reach the exporter. The naive approach — flip a random coin per trace — has a real problem in a distributed system: the EA and the Python service would each make their own independent coin flip, and half the time only one side of a trace would survive. Head-based ratio sampling avoids this by deriving the decision from the trace ID itself, which both processes already share.
//+------------------------------------------------------------------+
//| COtelSampler::ShouldSample                                       |
//| Returns true when the trace should be recorded. Reads the last   |
//| 16 hex characters of the trace ID (its lower 8 bytes) against a  |
//| threshold, the same approach OpenTelemetry's published           |
//| TraceIdRatioBased sampler describes. The Python service in this  |
//| project doesn't run this check itself; see OtelTracer.mqh for    |
//| how it inherits the decision.                                    |
//+------------------------------------------------------------------+
bool COtelSampler::ShouldSample(const string trace_id) const
  {
//--- ratio 1.0 or above: skip the ID check entirely, since nothing can fail it
   if(m_always)
      return(true);
//--- a malformed ID is never sampled, rather than risking an out-of-range
//--- substring read below
   if(StringLen(trace_id)!=OTEL_TRACE_ID_HEX)
      return(false);
//--- the lower 64 bits, not the upper: the same approach OpenTelemetry's
//--- published TraceIdRatioBased sampler describes (not independently
//--- verified against every SDK and spec version)
   const int half=OTEL_TRACE_ID_HEX/2;
   const ulong value=OtelHexToU64(StringSubstr(trace_id,half,half));
   return(value<m_bound);
  }
The lower 64 bits of the trace ID, read as an unsigned integer, are compared against a threshold computed once from the ratio. Any process that implements this same check reaches the identical verdict on a given trace ID without exchanging a single message about it, because the check depends on nothing but the ID and the ratio, both already shared. The Python service in this project does not actually run that check itself: it inherits the EA's decision through the OpenTelemetry SDK's default parent-based sampler, which reads the sampled flag already sitting in the incoming traceparent header rather than recomputing anything. That is the more common pattern for a child span, and it still depends on the same property — a decision made once, near the root, that every downstream span can trust rather than re-derive.
OtelTracer.mqh: Spans, the Stack, and the Scope Guard
Status is sticky in one direction. The OpenTelemetry specification treats OK as a final verdict: once a span is marked OK, nothing should later downgrade it to UNSET or ERROR. SetStatus() enforces exactly that — it is a no-op once OK has already been set.
//+------------------------------------------------------------------+
//| COtelSpan::SetStatus                                             |
//| Sets the span verdict. OK is final and cannot be overwritten, as |
//| the OpenTelemetry specification requires. A message is only      |
//| meaningful, and only stored, for ERROR.                          |
//+------------------------------------------------------------------+
void COtelSpan::SetStatus(const ENUM_OTEL_STATUS code,const string message)
  {
//--- OK is a final verdict under the OpenTelemetry spec: once set, nothing
//--- later in the function, including a delayed Fail(), may downgrade it
   if(m_status==OTEL_STATUS_OK)
      return;
   m_status=code;
//--- a message is only meaningful for ERROR, so anything else clears it
//--- rather than carrying a stale string from an earlier call
   m_status_msg=(code==OTEL_STATUS_ERROR) ? message : "";
  }
COtelTracer::StartSpan — the stack is what makes nesting automatic. The tracer keeps an array of currently open spans. A root span — nothing else open — gets a freshly generated trace ID and the sampler makes its one decision for that whole trace. A child span, opened while another is still on the stack, silently inherits the parent's trace ID, records the parent's span ID, and copies the parent's sampling verdict rather than asking the sampler again. That inheritance is what turns four or five independently-written functions into one coherent tree, without any of them needing to know they are nested inside anything.
//+------------------------------------------------------------------+
//| COtelTracer::StartSpan                                           |
//| Opens a span and pushes it on the stack. With no open span the   |
//| new one is a root: it gets a new trace ID and the sampler        |
//| decides once for the whole trace. Otherwise it inherits trace ID |
//| and verdict from the active span and records that span as its    |
//| parent.                                                          |
//|                                                                  |
//| Returns NULL when the tracer is disabled, the stack is full or   |
//| identifier generation failed. All COtelScope methods accept      |
//| that.                                                            |
//+------------------------------------------------------------------+
COtelSpan *COtelTracer::StartSpan(const string name,const ENUM_OTEL_SPAN_KIND kind)
  {
   if(!m_enabled)
      return(NULL);
   if(m_depth>=OTEL_MAX_DEPTH)
     {
      m_overflow++;
      return(NULL);
     }
   string trace_id;
   string parent_id="";
   bool sampled;
   COtelSpan *parent=Active();
   if(parent==NULL)
     {
      //--- root span: new trace, one sampling decision for all its descendants
      trace_id=m_ids.NewTraceId();
      if(trace_id=="")
         return(NULL);
      sampled=m_sampler.ShouldSample(trace_id);
     }
   else
     {
      //--- child span: everything except the span ID comes from the parent
      trace_id=parent.TraceId();
      parent_id=parent.SpanId();
      sampled=parent.IsSampled();
     }
   const string span_id=m_ids.NewSpanId();
   if(span_id=="")
      return(NULL);
   COtelSpan *span=new COtelSpan();
   span.Begin(trace_id,span_id,parent_id,name,kind,sampled,m_clock.NowNanos());
   m_stack[m_depth]=span;
   m_depth++;
   m_started++;
   return(span);
  }
COtelTracer::EndSpan — closing an orphaned child instead of leaking it. The expected case is that the span passed in is the top of the stack, and only it closes. But if a bug — or a future refactor — leaves a child span open when its parent ends, walking the stack down to the requested span and closing everything above it first is the policy this implementation chooses, rather than shipping a span whose parent has already finished. A child outliving its parent isn't necessarily an invalid trace by any formal OpenTelemetry rule — it's more about how a given backend renders overlapping intervals — but closing it here with an ERROR status and a clear reason means the trace documents the ordering bug itself rather than leaving it to be silently discarded.
//+------------------------------------------------------------------+
//| COtelTracer::EndSpan                                             |
//| Ends a span and every span above it on the stack. Normally the   |
//| span is the top of the stack and only it ends. If a child was    |
//| left open, it is closed first with an ERROR status, so the       |
//| exported trace stays a valid tree instead of containing a child  |
//| that outlives its parent.                                        |
//|                                                                  |
//| A span that is not on the stack (already ended, or never         |
//| started) is ignored, and its memory is never touched.            |
//+------------------------------------------------------------------+
void COtelTracer::EndSpan(COtelSpan *span)
  {
   if(span==NULL)
      return;
   int index=-1;
   for(int i=m_depth-1;i>=0;i--)
     {
      if(m_stack[i]==span)
        {
         index=i;
         break;
        }
     }
   if(index<0)
      return;
   const ulong now=m_clock.NowNanos();
//--- pop from the top down to the requested span; children end first
   for(int i=m_depth-1;i>=index;i--)
     {
      COtelSpan *item=m_stack[i];
      m_stack[i]=NULL;
      m_depth=i;
      if(i>index)
         item.SetStatus(OTEL_STATUS_ERROR,"span ended out of order");
      Retire(item,now);
     }
  }
COtelScope — RAII, the way MQL5 allows it. MQL5 supports constructors and destructors on stack-allocated class instances, which is enough to build a proper scope guard: the constructor opens a span, the destructor closes it, and a function that returns early — through any of several branches — still closes its span correctly, because the destructor fires on every normal exit path. That guarantee has one real exception, covered in Limitations below: it depends on the function actually returning, so a span left open across a terminal crash or an unhandled early shutdown is discarded by the tracer's own destructor instead, never exported.
//+------------------------------------------------------------------+
//| COtelScope                                                       |
//| Scope guard for one span. The constructor starts the span and    |
//| the destructor ends it, so the span is closed on every exit path |
//| of the function, including early returns. Guards in nested       |
//| function calls are destroyed innermost first, because each       |
//| function returns before its caller, which is exactly the LIFO    |
//| order the tracer's stack needs.                                  |
//|                                                                  |
//| A NULL tracer or a refused span turns every method into a no-op, |
//| so instrumented code needs no if(tracing) checks.                |
//+------------------------------------------------------------------+
class COtelScope
  {
private:
//--- the span this guard owns for the lifetime of the scope
   COtelTracer*         m_tracer;  // may be NULL when tracing is off
   COtelSpan*           m_span;    // NULL when no span was started
public:
                        COtelScope(COtelTracer *tracer,const string name,
                                   const ENUM_OTEL_SPAN_KIND kind=OTEL_KIND_INTERNAL);
                        ~COtelScope(void);
   void                 AttrStr(const string key,const string value);
   void                 AttrInt(const string key,const long value);
   void                 AttrDbl(const string key,const double value);
   void                 AttrBool(const string key,const bool value);
   void                 Event(const string name);
   void                 Fail(const string message);
   string               TraceParent(void) const;
  };
The destructor is deliberately minimal. It does not force the span to OK on the way out — a span's status starts UNSET, and UNSET is exactly what a successful, unremarkable span should end its life as under the OpenTelemetry specification. Any code path that hit a real problem calls Fail() explicitly before returning, which sets ERROR, and the destructor never calls SetStatus() at all, so nothing later can touch that status either way.
SetStatus() itself only guards one direction: once a span is OK, nothing — not even a later Fail() — can change it again, while ERROR and the default UNSET stay freely overwritable. No code path here currently sets OK explicitly, so that guard isn't exercised yet, but it matters for anyone extending COtelSpan directly, where marking success becomes a deliberate call instead of an implicit default. The net effect: instrumented code needs no if(tracing) checks anywhere, since a NULL tracer or a span the tracer refused to start turns every method on the guard into a silent no-op.
//+------------------------------------------------------------------+
//| COtelScope::~COtelScope                                          |
//| Destructor. Ends the span. A scope that finishes without Fail()  |
//| leaves the status UNSET, which OpenTelemetry treats as success   |
//| and which backends do not flag; only ERROR spans are             |
//| highlighted.                                                     |
//+------------------------------------------------------------------+
COtelScope::~COtelScope(void)
  {
//--- a NULL tracer or a span StartSpan() refused to open leaves nothing to
//--- close, so an inert scope destructs as a true no-op
   if(m_tracer==NULL || m_span==NULL)
      return;
//--- no SetStatus(OK) call here: the span already started UNSET, and
//--- UNSET is what a successful span should stay unless Fail() ran
   m_tracer.EndSpan(m_span);
   m_span=NULL;
  }
OtlpExporter.mqh: The Bounded Queue and the WebRequest Path
WebRequest() is synchronous and blocks whatever called it, so it can never run from OnTick() without risking a stall on every tick a collector is slow to answer. The exporter is built around that constraint: spans are pushed into a fixed-size ring queue the instant they finish, and only OnTimer() ever calls WebRequest(), at most once per timer tick.
//+------------------------------------------------------------------+
//| COtlpExporter                                                    |
//| Bounded queue plus OTLP/HTTP JSON transport. Serialized spans    |
//| are pushed into a ring buffer and leave it in batches through    |
//| WebRequest(). The queue never grows: when it is full the oldest  |
//| span is dropped, because fresh data is worth more than stale     |
//| data during an outage.                                           |
//|                                                                  |
//| WebRequest() is synchronous and blocks the EA thread, so         |
//| delivery is driven from OnTimer() only, at most one request per  |
//| call, with exponential backoff and jitter after failures. In the |
//| Strategy Tester the sink counts bytes instead of sending.        |
//+------------------------------------------------------------------+
class COtlpExporter
  {
private:
//--- destination and the resource identity attached to every batch
   string               m_endpoint;       // OTLP/HTTP traces URL
   string               m_scope_name;     // instrumentation scope name
   string               m_scope_version;  // instrumentation scope version
   string               m_res_keys[];     // resource attribute names
   string               m_res_vals[];     // resource attribute values
   int                  m_res_count;      // resource attributes in use
//--- bounded ring queue with one serialized span per slot
   string               m_queue[];   // ring storage
   int                  m_capacity;  // number of slots
   int                  m_head;      // index of the oldest span
   int                  m_count;     // spans currently queued
//--- delivery policy
   int                  m_batch_size;     // most spans per request
   int                  m_timeout_ms;     // WebRequest() timeout
   int                  m_base_delay_ms;  // first retry delay
   int                  m_max_delay_ms;   // retry delay ceiling
   bool                 m_noop;           // tester mode: count, never send
//--- retry state
   int                  m_fail_streak;      // consecutive failed requests
   ulong                m_next_attempt_ms;  // earliest next request, tick clock
   ulong                m_last_log_ms;      // last failure line, tick clock
   int                  m_last_error;       // GetLastError() of the last request
   string               m_last_reply;       // start of the last response body
//--- self-telemetry
   ulong                m_exported;                          // spans accepted by the collector
   ulong                m_dropped;                           // spans lost to overflow or rejection
   ulong                m_batches;                           // successful requests
   ulong                m_failures;                          // failed requests
   ulong                m_bytes;                             // payload bytes delivered
   ulong                m_last_bytes;                        // size of the most recent payload
   ulong                m_latency_us[OTEL_LATENCY_SAMPLES];  // flush duration ring
   int                  m_latency_n;                         // valid entries in the ring
   int                  m_latency_pos;                       // next ring slot to overwrite
//--- internal steps
   string               BuildPayload(const int count) const;
   int                  Post(const string payload);
   int                  SendBatch(void);
   void                 PopFront(const int count);
   void                 ScheduleRetry(void);
   void                 NoteLatency(const ulong microseconds);
   void                 LogFailure(const int status);
   bool                 IsRetryable(const int status) const;
public:
                        COtlpExporter(void);
   bool                 Init(const string endpoint,const int capacity,const int batch_size,
                             const int timeout_ms,const int base_delay_ms,const int max_delay_ms);
   bool                 AddResourceAttr(const string key,const string value);
   void                 Enqueue(const string span_json);
   int                  Pump(void);
   void                 Drain(const int timeout_ms);
   double               LatencyPercentile(const double p) const;
   string               StatsLine(void) const;
   int                  QueueDepth(void) const;
   ulong                Exported(void) const;
   ulong                Dropped(void) const;
   ulong                Failures(void) const;
   bool                 IsNoop(void) const;
  };
Enqueue — the oldest span loses, not the newest. When the ring is full, the incoming span isn't the one dropped; the oldest queued span is overwritten instead and counted in the dropped total. That rests on an assumption worth stating rather than treating as a law: during an outage, what's happening now is usually more useful than what happened five minutes ago, but that won't hold for every incident — a one-off event right before the outage could matter more than the steady stream after it. Oldest-first eviction is simply the simpler, more common choice, not a claim it's always right.
//+------------------------------------------------------------------+
//| COtlpExporter::Enqueue                                           |
//| Appends one serialized span. When the ring is full the oldest    |
//| entry is overwritten and counted as dropped, so the call never   |
//| blocks and never allocates. Memory use is bounded by capacity *  |
//| average span size.                                               |
//+------------------------------------------------------------------+
void COtlpExporter::Enqueue(const string span_json)
  {
   if(m_capacity==0)
      return;
//--- full ring: advance the head, which discards the oldest span
   if(m_count==m_capacity)
     {
      m_queue[m_head]="";
      m_head=(m_head+1)%m_capacity;
      m_count--;
      m_dropped++;
     }
   const int tail=(m_head+m_count)%m_capacity;
   m_queue[tail]=span_json;
   m_count++;
  }
Post — one UTF-8 byte-count bug worth calling out explicitly.StringToCharArray() always writes the terminating zero byte along with the text. Passing that array straight to WebRequest() at its full length sends a trailing NUL after the JSON body's closing brace, and several collector implementations answer that with HTTP 400 rather than silently ignoring the extra byte. Trimming the array by one byte after conversion avoids it, and it is exactly the kind of detail that only surfaces once you are testing against a real collector rather than just checking that the JSON parses.
//+------------------------------------------------------------------+
//| COtlpExporter::Post                                              |
//| Encodes a payload as UTF-8 and sends it with WebRequest().       |
//| Returns the HTTP status on a completed request. A failed request |
//| isn't guaranteed to come back as exactly -1; m_last_error is     |
//| only set for that exact value (see the fault-injection log below |
//| for a real example that didn't).                                 |
//| The duration of every call is recorded in the latency ring,      |
//| including tester-mode calls, where it measures serialization     |
//| only.                                                            |
//+------------------------------------------------------------------+
int COtlpExporter::Post(const string payload)
  {
   char body[];
   char reply[];
   string reply_headers;
   const ulong started=GetMicrosecondCount();
//--- StringToCharArray() also writes the terminating zero, and a NUL after
//--- the closing brace makes many collectors return 400, so drop that
//--- last byte; counting bytes this way stays correct for non-ASCII text
   int length=StringToCharArray(payload,body,0,WHOLE_ARRAY,CP_UTF8)-1;
   if(length<0)
      length=0;
   ArrayResize(body,length);
   m_last_bytes=(ulong)length;
   m_last_error=0;
   m_last_reply="";
//--- tester and optimizer: no network, so report success immediately
   if(m_noop)
     {
      NoteLatency(GetMicrosecondCount()-started);
      return(200);
     }
   ResetLastError();
   const int status=WebRequest("POST",m_endpoint,"Content-Type: application/json\r\n",
                               m_timeout_ms,body,reply,reply_headers);
   NoteLatency(GetMicrosecondCount()-started);
//--- -1 means transport failure; keep the error code, otherwise keep the
//--- start of the body, which is where collectors put their message
   if(status==-1)
      m_last_error=GetLastError();
   else
      m_last_reply=CharArrayToString(reply,0,MathMin(ArraySize(reply),200),CP_UTF8);
   return(status);
  }
ScheduleRetry — exponential backoff with jitter. A fleet of EAs that all lost their connection to the same collector at the same moment, and all retry on a fixed schedule, would hammer that collector in lockstep the instant it comes back. The delay after each failure doubles, capped at a configurable ceiling, and gets a random 0-25% jitter added on top, so recovering traffic spreads out instead of arriving as one synchronized burst.
//+------------------------------------------------------------------+
//| COtlpExporter::ScheduleRetry                                     |
//| Sets the earliest time of the next request after a failure. The  |
//| delay is min(max, base * 2^k) * (1 + 0.25 * u) with k the        |
//| failure streak minus one and u a uniform random number in [0,1), |
//| so a fleet of EAs does not hammer a recovering collector in      |
//| lock-step.                                                       |
//+------------------------------------------------------------------+
void COtlpExporter::ScheduleRetry(void)
  {
//--- the exponent is capped: 2^20 is far above any sensible ceiling
//--- and keeps the double arithmetic well inside range
   const int exponent=MathMin(m_fail_streak-1,20);
   double delay=(double)m_base_delay_ms*MathPow(2.0,(double)exponent);
   delay=MathMin(delay,(double)m_max_delay_ms);
   delay*=1.0+0.25*((double)MathRand()/32767.0);
   m_next_attempt_ms=GetTickCount64()+(ulong)delay;
  }
SendBatch — retryable failures keep the batch, permanent ones don't. A transport failure, a 408, a 429, or any 5xx is treated as transient: the batch stays queued and a retry is scheduled. Any other non-2xx status is treated as permanent by this exporter specifically, which drops the batch rather than retrying it, on the assumption that resending identical bytes won't succeed. That's a policy choice, not a guarantee — a collector's rejection can depend on batch size, authentication, or its own configuration, any of which could change between requests — but it keeps one bad batch from blocking every span queued behind it forever.
//+------------------------------------------------------------------+
//| COtlpExporter::SendBatch                                         |
//| Sends the oldest batch. Returns the number of spans removed from |
//| the queue (delivered, or dropped because the collector rejected  |
//| them permanently), 0 when the queue is empty, and -1 when the    |
//| request failed and the batch stays queued for a later retry.     |
//|                                                                  |
//| Nothing can enqueue while WebRequest() blocks, because the EA is |
//| single-threaded, so removing exactly n spans afterwards always   |
//| removes the ones that were sent.                                 |
//+------------------------------------------------------------------+
int COtlpExporter::SendBatch(void)
  {
   if(m_count==0)
      return(0);
   const int n=MathMin(m_batch_size,m_count);
   const int status=Post(BuildPayload(n));
//--- 2xx: the collector accepted the batch
   if(status>=200 && status<300)
     {
      PopFront(n);
      m_exported+=n;
      m_batches++;
      m_bytes+=m_last_bytes;
      m_fail_streak=0;
      return(n);
     }
//--- transient failure: keep the batch, back off, try again later
   m_failures++;
   m_fail_streak++;
   LogFailure(status);
   if(IsRetryable(status))
     {
      ScheduleRetry();
      return(-1);
     }
//--- permanent rejection: retrying identical bytes cannot help, and
//--- keeping the batch would block every span queued behind it
   PopFront(n);
   m_dropped+=n;
   return(n);
  }
In the Strategy Tester, WebRequest() is not available at all, so Init() detects MQL_TESTER or MQL_OPTIMIZATION and switches the exporter into a no-op sink: spans are still serialized and their byte size is still counted, which is enough to measure the tracer's own CPU overhead, but nothing ever leaves the process. This is also what makes a fair tracing-on-versus-tracing-off backtest comparison possible in the first place — see the Testing section below.
EA Integration: OtelTraced_EA.mq5
The EA itself is a plain EMA-cross harness — fast and slow EMA, RSI and ATR as model features, ATR-scaled stop and target — chosen deliberately simple so that the tracing plumbing is the thing actually on display, not a complicated strategy. Tracing is fully optional and driven by a single input group.
//+------------------------------------------------------------------+
//| Inputs: Tracing                                                  |
//| Switches and limits for the tracer and the OTLP exporter. With   |
//| InpTracing off, no tracer and no exporter are created and every  |
//| scope in the trading code becomes a no-op. The endpoint must be  |
//| added to Tools > Options > Expert Advisors > Allow WebRequest.   |
//+------------------------------------------------------------------+
input group "Tracing and OTLP export"
input bool   InpTracing       = true;                               // trace every bar cycle
input string InpOtlpEndpoint  = "http://localhost:4318/v1/traces";  // OTLP/HTTP traces URL
input string InpEnvironment   = "demo";                             // deployment.environment tag
input double InpSampleRatio   = 1.0;                                // share of cycles recorded, 0-1
input int    InpBatchSize     = 64;                                 // spans per export request
input int    InpQueueCapacity = 2048;                               // spans buffered offline
input int    InpTimeoutMs     = 800;                                // export request timeout
input int    InpFlushMs       = 1000;                               // exporter timer period
input int    InpSlowFlushMs   = 25;                                 // slow-flush span threshold
These defaults suit a live M5 chart on a local or nearby collector, not a busy multi-symbol EA. A bar cycle fires at most once every five minutes, so even counting every attribute write as its own span, the load is light and bursty — InpBatchSize=64 lets several cycles accumulate before a batch goes out instead of firing near-empty requests. InpQueueCapacity=2048 absorbs several hours of a collector outage before the oldest span gets overwritten; it is sized for an outage, not a permanent split. InpTimeoutMs=800 clears a normal round trip to a local collector like the Jaeger instance used below without letting one stuck request stall OnTimer() for long — raise it for a remote collector with real latency. InpSlowFlushMs=25 only needs to catch flushes slow against that same local baseline; on a slower link it should move up too, or every flush gets tagged slow.
Every EA-owned object the timer and the trading logic touch lives as a global, created once in OnInit() and torn down in OnDeinit().
//+------------------------------------------------------------------+
//| Globals                                                          |
//| Trade object, telemetry objects, indicator handles and the       |
//| bookkeeping the timer and the new-bar test need. The tracer and  |
//| exporter are pointers because they only exist when InpTracing is |
//| on.                                                              |
//+------------------------------------------------------------------+
CTrade         g_trade;                           // order execution
COtelTracer*   g_tracer        = NULL;            // tracer, NULL when tracing is off
COtlpExporter* g_exporter      = NULL;            // exporter, NULL when tracing is off
int            g_h_fast        = INVALID_HANDLE;  // fast EMA handle
int            g_h_slow        = INVALID_HANDLE;  // slow EMA handle
int            g_h_rsi         = INVALID_HANDLE;  // RSI handle
int            g_h_atr         = INVALID_HANDLE;  // ATR handle
datetime       g_last_bar      = 0;               // open time of the last bar processed
ulong          g_last_stats_ms = 0;               // tick clock of the last stats line
RunBarCycle — the root span, and steps ordered cheapest first. Every step opens its own COtelScope, but they don't chain into each other the way four scopes declared back-to-back in the same function would. cycle is opened once, at the top of this function, and stays on the tracer's stack until RunBarCycle() returns, so every helper it calls — LoadSnapshot(), RiskAllows(), ConfirmWithService(), ExecuteSignal() — opens and closes its own span entirely inside its own call, while bar_cycle is still the only thing open above it. That makes features.build, risk.check, model.infer, and order.send siblings under one shared root, not a growing chain, matching the flat shape in Figure 1's span tree.
The one place real nesting goes a level deeper is inside ConfirmWithService(), covered below: the HTTP request to the Python service carries a traceparent built from model.infer while that span is still active, so the Python side's own spans land as its children, not bar_cycle's. The step order matters for a separate reason that has nothing to do with tracing: feature calculation and the risk check are essentially free, so they run before the network call, which runs before the order itself — an early exit never pays for a step further down the chain.
//+------------------------------------------------------------------+
//| RunBarCycle                                                      |
//| One traced decision: the root span of a trace. Steps run         |
//| cheapest first, features, then the local risk gate, then the     |
//| remote model, then the order, so an early exit never pays for a  |
//| later step. Every step opens its own scope, and the tracer's     |
//| stack turns that nesting into the parent-child tree.             |
//+------------------------------------------------------------------+
void RunBarCycle(void)
  {
   COtelScope cycle(g_tracer,"bar_cycle",OTEL_KIND_INTERNAL);
   cycle.AttrStr("symbol",_Symbol);
   cycle.AttrStr("timeframe",EnumToString(_Period));
   SBarSnapshot snap;
   if(!LoadSnapshot(snap))
     {
      cycle.Fail("no indicator data");
      return;
     }
   const int direction=CrossDirection(snap);
   cycle.AttrInt("signal.direction",direction);
//--- no cross: the cycle ends here and the trace records the cheap path
   if(direction==0)
      return;
   if(!RiskAllows(direction))
     {
      cycle.AttrStr("outcome","blocked by risk");
      return;
     }
   double score=0.5;
   if(!ConfirmWithService(snap,direction,score))
     {
      cycle.AttrStr("outcome","blocked by service");
      return;
     }
   if(ExecuteSignal(direction,snap))
      cycle.AttrStr("outcome","order sent");
   else
     {
      cycle.AttrStr("outcome","order failed");
      cycle.Fail("order failed");
     }
  }
ConfirmWithService — the traceparent hop. This is the one function in the EA that talks to another process, and it is where the whole point of the article actually happens: the HTTP request carries a traceparent header built from this span, so the Python service's own span becomes this span's child rather than the start of a disconnected trace. If no service is configured, or the EA is running in the Strategy Tester where WebRequest() does not work, the function returns true immediately and the EA trades on its local signal alone.
//+------------------------------------------------------------------+
//| ConfirmWithService                                               |
//| Asks the Python signal service to score the setup and applies    |
//| the threshold: a buy needs score >= InpMinScore, a sell needs    |
//| score <= 1 - InpMinScore. The span is CLIENT kind, and the       |
//| request carries a traceparent header built from it, so the       |
//| service's own span joins the same trace as its child.            |
//|                                                                  |
//| Returns true when no service is configured or when the tester is |
//| running. If the service is configured but fails, the trade is    |
//| skipped (fail closed), and the failure shows in the trace with   |
//| its reason.                                                      |
//+------------------------------------------------------------------+
bool ConfirmWithService(const SBarSnapshot &snap,const int direction,double &score)
  {
   score=0.5;
   if(!InpUseService || MQLInfoInteger(MQL_TESTER)!=0)
      return(true);
   COtelScope scope(g_tracer,"model.infer",OTEL_KIND_CLIENT);
   scope.AttrStr("http.method","POST");
   scope.AttrStr("http.url",InpServiceUrl);
   const string request=StringFormat("{\"symbol\":\"%s\",\"features\":[%s,%s,%s]}",_Symbol,
                                     DoubleToString(snap.f0,6),DoubleToString(snap.f1,6),
                                     DoubleToString(snap.f2,6));
//--- traceparent is what stitches the two processes into one trace: the
//--- service reads it and parents its own span on this span
   string headers="Content-Type: application/json\r\n";
   const string parent=scope.TraceParent();
   if(parent!="")
      headers+="traceparent: "+parent+"\r\n";
   char body[];
   char reply[];
   string reply_headers;
//--- UTF-8 bytes without the terminating zero that StringToCharArray() adds
   const int length=StringToCharArray(request,body,0,WHOLE_ARRAY,CP_UTF8)-1;
   ArrayResize(body,MathMax(length,0));
   ResetLastError();
   const int status=WebRequest("POST",InpServiceUrl,headers,InpServiceTimeoutMs,
                               body,reply,reply_headers);
//--- read the error code before any other call can overwrite it
   const int error=GetLastError();
   scope.AttrInt("http.status_code",status);
   if(status!=200)
     {
      scope.Fail(status==-1 ? "service unreachable, error "+IntegerToString(error)
                            : "service returned HTTP "+IntegerToString(status));
      return(false);
     }
   const string text=CharArrayToString(reply,0,WHOLE_ARRAY,CP_UTF8);
   if(!JsonGetNumber(text,"score",score))
     {
      scope.Fail("response has no numeric score");
      return(false);
     }
   scope.AttrDbl("service.score",score);
   const bool confirmed=(direction>0) ? (score>=InpMinScore) : (score<=1.0-InpMinScore);
   scope.AttrBool("service.confirmed",confirmed);
   return(confirmed);
  }
ExecuteSignal — what makes an order slow or expensive, made visible. A reversal first closes the opposite position, which is itself worth an event on the span rather than a silent extra network call the trace would otherwise hide. The span then records the broker's own retcode, the round-trip latency of the trade call in microseconds, the terminal's last known ping, and — once a fill price is known — the slippage against the price that was actually requested.
//+------------------------------------------------------------------+
//| ExecuteSignal                                                    |
//| Closes an opposite position if there is one, then sends the      |
//| market order with ATR-based stop and target. The order.send span |
//| records what makes execution slow or expensive: the server       |
//| retcode, the round trip in microseconds, the terminal's last     |
//| ping and the slippage against the price requested.               |
//+------------------------------------------------------------------+
bool ExecuteSignal(const int direction,const SBarSnapshot &snap)
  {
   COtelScope scope(g_tracer,"order.send",OTEL_KIND_CLIENT);
   scope.AttrStr("order.side",direction>0 ? "buy" : "sell");
   ulong ticket=0;
   const int open_direction=OpenDirection(ticket);
//--- a reversal closes the old position first, so the account is never
//--- long and short on the same symbol at the same time
   if(open_direction!=0 && open_direction!=direction)
     {
      scope.Event("closing opposite position");
      if(!g_trade.PositionClose(ticket))
        {
         scope.Fail("close failed: "+g_trade.ResultRetcodeDescription());
         return(false);
        }
     }
   const double price=(direction>0) ? SymbolInfoDouble(_Symbol,SYMBOL_ASK)
                                    : SymbolInfoDouble(_Symbol,SYMBOL_BID);
   const double sl_distance=InpAtrSlMult*snap.atr;
   const double tp_distance=InpAtrTpMult*snap.atr;
//--- sign flips the stop and target sides: below the price for a buy,
//--- above it for a sell
   const double sign=(direction>0) ? 1.0 : -1.0;
   const double sl=NormalizeDouble(price-sign*sl_distance,_Digits);
   const double tp=NormalizeDouble(price+sign*tp_distance,_Digits);
   const double lots=NormalizeVolume(InpLots);
//--- time only the trade call itself, so the attribute is the server round trip
   const ulong started=GetMicrosecondCount();
   const bool sent=(direction>0) ? g_trade.Buy(lots,_Symbol,price,sl,tp,"otel-ea")
                                 : g_trade.Sell(lots,_Symbol,price,sl,tp,"otel-ea");
   const ulong elapsed=GetMicrosecondCount()-started;
   const uint retcode=g_trade.ResultRetcode();
   const double fill=g_trade.ResultPrice();
   scope.AttrInt("order.retcode",(long)retcode);
   scope.AttrInt("order.latency_us",(long)elapsed);
   scope.AttrInt("terminal.ping_us",(long)TerminalInfoInteger(TERMINAL_PING_LAST));
   scope.AttrDbl("order.requested_price",price);
   scope.AttrDbl("order.volume",lots);
   const bool done=(sent && retcode==TRADE_RETCODE_DONE);
   if(!done)
     {
      scope.Fail(g_trade.ResultRetcodeDescription());
      return(false);
     }
//--- positive slippage means the fill was worse than the requested price
   if(fill>0.0)
      scope.AttrDbl("order.slippage_points",((direction>0) ? fill-price : price-fill)/_Point);
   return(true);
  }
OnTimer — pumping the exporter, and tracing the tracer. Most flushes are fast enough that recording a span for every single one would generate more tracing traffic than the trading itself. Only a flush slower than InpSlowFlushMs gets its own otel.export span, via RecordSpan() rather than the usual scope guard, since this measurement already has its own start and end time in hand and does not need the stack-based nesting the rest of the EA relies on.
//+------------------------------------------------------------------+
//| OnTimer                                                          |
//| Drives the exporter. Each call sends at most one batch. A flush  |
//| that blocked for longer than InpSlowFlushMs is recorded as an    |
//| otel.export span, so the cost of observability is itself         |
//| observable. Fast flushes are not recorded: a span per flush      |
//| would generate the very traffic the next flush has to carry.     |
//+------------------------------------------------------------------+
void OnTimer(void)
  {
   if(g_exporter==NULL || g_tracer==NULL)
      return;
   const ulong started_ns=g_tracer.NowNanos();
   const ulong started_us=GetMicrosecondCount();
   const int sent=g_exporter.Pump();
   const ulong elapsed_us=GetMicrosecondCount()-started_us;
   if(sent>0 && elapsed_us>=(ulong)InpSlowFlushMs*1000)
      g_tracer.RecordSpan("otel.export",started_ns,g_tracer.NowNanos(),"spans.sent",(long)sent);
//--- one stats line every 30 seconds keeps the Experts log readable
   if(GetTickCount64()-g_last_stats_ms>=30000)
     {
      g_last_stats_ms=GetTickCount64();
      ReportStats();
     }
  }
signal_service.py: Continuing the Trace in Python
The companion service is a small threaded HTTP server that scores the three features the EA sends and answers with a probability. Its only job relevant to this article is reading the incoming traceparent header and starting its own span as a child of whatever it names, using the standard opentelemetry SDK rather than anything custom — Python already has a mature OTLP exporter, so there was no reason to hand-roll one the way MQL5 required.
    def do_POST(self):
        if self.path != "/predict":
            self._reply(404, {"error": "not found"})
            return

        # propagate.extract() reads `traceparent` (and `tracestate`) from the
        # headers and returns a context whose current span is the EA's span.
        parent_context = propagate.extract(self.headers)

        with self.tracer.start_as_current_span(
            "signal.predict", context=parent_context, kind=SpanKind.SERVER
        ) as span:
            span.set_attribute("http.request.method", "POST")
            span.set_attribute("url.path", self.path)
            try:
                length = int(self.headers.get("Content-Length", "0"))
                body = json.loads(self.rfile.read(length))

                with self.tracer.start_as_current_span("features.validate"):
                    features = validate_features(body)

                with self.tracer.start_as_current_span("model.score") as scoring:
                    score = score_features(features)
                    scoring.set_attribute("model.name", "logistic-v1")
                    scoring.set_attribute("model.score", score)

                span.set_attribute("http.response.status_code", 200)
                self._reply(200, {"score": score, "model": "logistic-v1"})
            except (ValueError, json.JSONDecodeError) as exc:
                span.record_exception(exc)
                span.set_status(Status(StatusCode.ERROR, str(exc)))
                span.set_attribute("http.response.status_code", 400)
                self._reply(400, {"error": str(exc)})
propagate.extract() reads the traceparent (and tracestate, if present) straight out of the request headers and returns a context object. Passing that context into start_as_current_span() is the entire mechanism — nothing else on the Python side needs to know or care that its caller happens to be an MQL5 terminal rather than another Python service.
The scoring function itself is intentionally a fixed logistic model rather than anything trained, since the point of this project is the tracing path, not the model.
def score_features(features):
    """Logistic score in (0, 1); above 0.5 leans long, below 0.5 leans short."""
    z = BIAS + sum(w * x for w, x in zip(WEIGHTS, features))
    # Clamp so math.exp() can never overflow on an extreme feature value
    z = max(-30.0, min(30.0, z))
    return 1.0 / (1.0 + math.exp(-z))
The tracer provider is created once at startup and exports to the same collector URL the EA points at, so both sides of every cross-process trace end up in one place.
def build_tracer(endpoint):
    """Create the tracer provider that exports to the OTLP/HTTP collector."""
    resource = Resource.create(
        {
            "service.name": "signal-service",
            "service.version": "1.0",
            "telemetry.sdk.language": "python",
        }
    )
    provider = TracerProvider(resource=resource)
    provider.add_span_processor(BatchSpanProcessor(OTLPSpanExporter(endpoint=endpoint)))
    trace.set_tracer_provider(provider)
    return provider, trace.get_tracer("signal_service")
Testing in the Strategy Tester and Live
Three separate tests were run, because "does tracing work" and "does tracing change trading" are two different questions and neither one answers the other.
Neutrality: tracing on versus tracing off, matched runs.WebRequest() does not run in the Strategy Tester, so the exporter's no-op sink means a backtest with tracing on never sends anything — it only serializes spans and counts their bytes, which makes the tester the right place to isolate the tracer's own CPU cost from any network effect. XAUUSD, M5, 2026-06-01 through 2026-09-25, every tick based on real ticks, 100,000 USD deposit, the EA at its default 20/50 EMA cross, were run twice back to back, changing only InpTracing. The table below has the full tester configuration and strategy parameters needed to reproduce both runs.
| Setting | Value |
|---|---|
| Symbol / timeframe | XAUUSD, M5 |
| Period | 2026.06.01 – 2026.09.25 |
| Modelling | Every tick based on real ticks (real historical spread, no separate spread setting) |
| Delays | Zero latency, ideal execution — no simulated slippage or requotes |
| Deposit / leverage | 100,000 USD, 1:100 |
| Commission | No override set in the tester; costs follow XAUUSD’s standard symbol specification |
| Fast EMA period / slow EMA period | 20 / 50 |
| RSI period / ATR period | 14 / 14 |
| Stop distance / target distance (ATR multiple) | 2.0 / 3.0 |
| Order volume | 0.1 lots |
| InpUseService | false — ConfirmWithService() also short-circuits in the tester regardless of this input, via MQLInfoInteger(MQL_TESTER) |
| Metric | Tracing off | Tracing on |
|---|---|---|
| Total trades/deals | 447/894 | 447/894 |
| Net profit | 1,016.34 USD | 1,016.34 USD |
| Gross profit/gross loss | 25,328.97/-24,312.63 | 25,328.97/-24,312.63 |
| Balance drawdown (max) | 2,580.83 (2.57%) | 2,580.83 (2.57%) |
| Profit factor | 1.04 | 1.04 |
Strategy Tester Report, Tracing Enabled
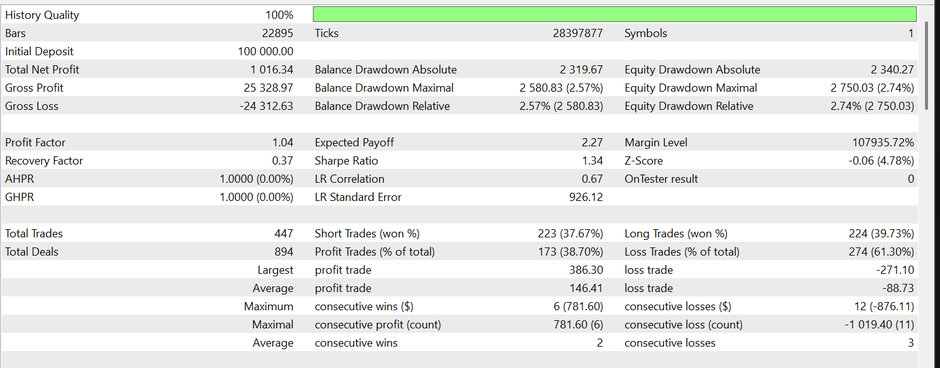
Fig. 2. The tracing-on backtest report. Every field here reproduced exactly with tracing turned off, on the same date range and inputs.
The tester's own [otel] final: line, printed in the Journal at the end of the tracing-on run, gives the tracer's own view of the same run — 46,684 spans exported, 0 dropped, 0 failures, 30,221,486 bytes total, all of it counted rather than sent, since the sink is a no-op here.
[otel] final: exported=46684 dropped=0 queued=0 batches=22895 failures=0 bytes=30221486 flush_p50=1us flush_p95=1us (tester sink: nothing was sent)
The flush_p50 and flush_p95 figures on that line are not network latency — nothing left the process, so they only time the UTF-8 payload encoding step. They are a reasonable proxy for how cheap that one step is, and nothing more; the real flush cost only shows up once a collector is actually on the other end, which the live test below covers.
Wall-clock overhead is harder to pin down than the trade-level comparison, because the Strategy Tester's own run time is sensitive to tick-data caching between runs — a cold first run can take several times longer than a warm second run, independent of tracing entirely. These timed runs weren't under a controlled protocol — no randomized order, warm-up, or confidence interval — so they only loosely separate tracing's cost from caching noise. The fastest run seen in each configuration gave roughly 5.4 seconds with tracing off against 9.1 seconds with tracing on across 22,895 bars — on the order of 150-200 microseconds of added CPU time per bar cycle. Treat that as an unverified rough band, not a benchmark result; what is not in doubt is the trade-for-trade result above.
Live trace: the cross-process link, end to end. With InpUseService=true and a Jaeger instance listening on http://127.0.0.1:4318, the EA was attached to a demo XAUUSD M1 chart. A fast 3/5 EMA pair was used only for this part, to produce crosses within minutes rather than the longer wait a 20/50 pair needs on M1 — not the shipped default, called out so the two numbers aren't confused. This shows the cross-process link works end to end; it isn't built to isolate the tracer's own overhead the way the backtest above is, since every live span timing here also carries the Python service's real network round trip.A Complete Cross-Process Trace
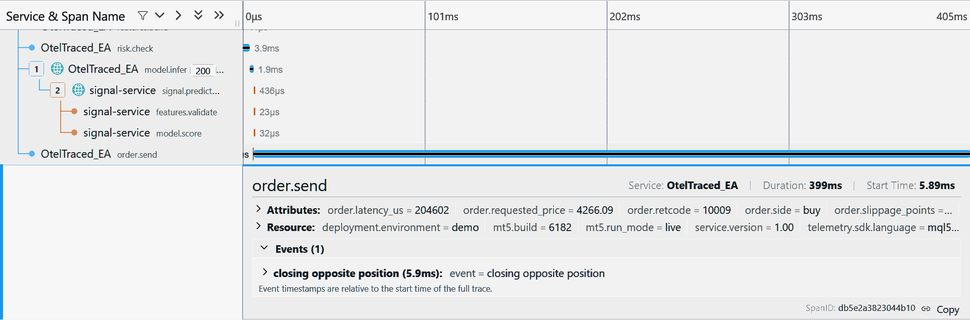
Fig. 3. A bar_cycle trace showing risk.check, model.infer, the Python signal-service spans nested under it, and order.send with its retcode and latency attributes.
This particular trace shows the EA reversing an open position: the order.send span carries a closing opposite position event before the fill, order.retcode = 10009 (TRADE_RETCODE_DONE), and an order.latency_us of roughly 205,000 — the round-trip time of the trade call itself against the demo server, separate from the close-then-open sequence the whole span covers. The nesting under model.infer confirms the traceparent hop worked exactly as designed: signal.predict, features.validate, and model.score all belong to the signal-service process, yet Jaeger draws them as children of the MQL5 span that called them, because both sides agreed on the same trace ID through nothing more than one HTTP header.
Not every trace in this run reaches an order. A cycle with no EMA cross stops after features.build, and a cycle where the service's score fell on the wrong side of the confirmation threshold stops after model.infer with outcome = "blocked by service" on the root span — both are correct, complete traces in their own right, and both were observed during this test alongside the full trade shown above.
Fault injection: stopping the collector mid-run. With the EA still trading against the live chart, the Jaeger process was killed outright and the Experts log watched for roughly three minutes before restarting it.
[otel] export failed: http=1001 error=0 streak=1 queued=2 (null)
[otel] export failed: http=1001 error=0 streak=8 queued=4 (null)
[otel] export failed: http=1001 error=0 streak=10 queued=6 (null)
[otel] exported=2 dropped=0 queued=10 batches=1 failures=10 bytes=1330 flush_p50=...
[otel] exported=12 dropped=0 queued=0 batches=2 failures=10 bytes=6018 flush_p50=...
The HTTP status of 1001 here is not a real HTTP code, and not the clean -1 that Post()'s comment describes for a failed request — it's whatever this installation's WebRequest() returned when the connection attempt failed, with no server there to answer. So this is exactly the retryable transport-failure path IsRetryable() is meant to catch. The retry interval visibly grows across ten straight failures; the fourth line above is a periodic stats snapshot, not a failed attempt — it shows queued reaching 10 while the backoff delay was still running, since new bar cycles keep enqueuing spans regardless of whether an export attempt is in flight. dropped stays at zero throughout, since ten spans is nowhere near the default 2,048-slot queue capacity.
Once Jaeger was back, the next scheduled retry succeeded, the full backlog went out in one batch, and queued returned to zero with dropped still at zero. In this run specifically — an outage short enough that the queue never neared its limit — nothing was lost, only delayed; a longer outage, or a smaller InpQueueCapacity, would start dropping spans as the trade-off in Limitations below describes.
Limitations and Practical Considerations
No native OTLP receiver is possible. Because MQL5 sockets are outbound-only, this project can never become a two-way integration where another service pushes data into the EA over OTLP; every exchange here is a request the EA or the Python service initiates, never one accepted on the MQL5 side.
The tester's timestamps and duration figures are not wall-clock accurate. COtelClock::Init() skips the second-edge wait in the tester because simulated time does not roll over the way real time does, which means absolute nanosecond timestamps from a tester run should not be read as real calendar time, even though span durations within a single run remain internally consistent.
A queue-capacity choice is a real trade-off, not a formality. A larger InpQueueCapacity survives a longer outage without dropping spans, at the cost of holding more unsent strings in memory; a smaller one frees memory faster but starts dropping the oldest spans sooner during a prolonged collector outage. There is no universally correct number here — it depends on how long an outage a given deployment needs to tolerate.
The confirmation service is a single point of added latency, by design. InpServiceTimeoutMs caps how long the EA waits on the Python service before treating the call as failed and skipping the trade (fail closed) — a slow or unreachable service doesn't block indefinitely, but every live signal takes on its round-trip time as part of its own decision latency, which order.latency_us doesn't include, since that only times the trade call itself.
Resource attributes are fixed at startup. deployment.environment, mt5.run_mode, and the rest are set once in StartTelemetry() and never change for the life of the EA; switching a chart from demo to live requires restarting the EA (or re-triggering its inputs) for the resource attributes to reflect it, since nothing in the exporter re-reads them mid-run.
A 2xx response is read as accepting the whole batch, not a partial one. OTLP/HTTP allows a partial_success body alongside a 2xx status; SendBatch() doesn't parse it, so a real partial rejection would be miscounted as a full success in m_exported.
Startup pays for clock accuracy with a busy-wait. COtelClock::Init() can spin for up to OTEL_SYNC_MAX_US (1.1 seconds) waiting for a TimeGMT() edge before OnInit() finishes — real startup cost traded for a more accurate clock.
Retry jitter and ID generation share the same desync mechanism, untested with multiple instances. MathSrand() is seeded once per EA instance, and MQL5 doesn't share that state across charts, which should also desync ScheduleRetry()'s jitter the way it desyncs generated IDs — not verified by actually running instances side by side.
The serialization code shown is representative, not complete. BuildPayload(), ToJson(), and the JSON helpers appear as excerpts; any OTLP/JSON compliance claim rests on the full source in MQL5.zip.
A span left open across an unhandled early terminal shutdown is discarded, not exported. COtelTracer's destructor frees any span still on the stack rather than exporting it, because a span with no real end timestamp would only mislead a backend that expects every span it receives to have a valid duration; OnDeinit() already drains the queue before that point, so this only affects a span whose own end was never reached, not spans that were already finished and queued.
Conclusion
Getting a working distributed trace out of MQL5 came down to working around three specific platform gaps rather than any single hard problem: building 128-bit identifiers when the only random source is a 15-bit generator, anchoring a nanosecond-formatted clock to a once-a-second wall-clock reading, and building a scope guard whose destructor does the right thing by default without needing an if(tracing) check scattered through every function. Once those three pieces existed, wiring the EA and a small Python service together over one HTTP header was the easy part — the traceparent mechanism is deliberately simple, and that simplicity is why it works the same way whether the two sides are both Python, both Go, or one MQL5 terminal and one Python service that have never otherwise been introduced.
The neutrality test is the result worth trusting most, but it's narrower than "tracing never affects trading": for this configuration, symbol, timeframe and date range, every trade matched with tracing on and off to the cent. It doesn't rule out a live-only effect — the blocking WebRequest() call covered earlier can delay a queued tick while OnTimer() waits on a slow collector, something a backtest can't exercise the way a live chart can. Anyone considering this for a live account should still size InpQueueCapacity and the timeout settings for their collector's reliability, and expect the confirmation service's round-trip time to join every live signal's latency budget.
| File | Type | Description |
|---|---|---|
| OtelCore.mqh | Include | Nanosecond clock, SHA-256-backed identifier generator, ratio sampler, and JSON-formatting helpers. No dependency on the rest of the project. |
| OtelTracer.mqh | Include | Span object, the stack-based tracer that makes parent-child nesting automatic, and the COtelScope RAII guard used throughout the EA. |
| OtlpExporter.mqh | Include | Bounded ring queue, OTLP/JSON batch assembly, and the WebRequest transport with exponential backoff and jitter. |
| OtelTraced_EA.mq5 | Expert Advisor | EMA-cross harness instrumented end to end: bar_cycle root span, local risk check, the traceparent hop to the Python service, and the traded order. |
| signal_service.py | Python script | Threaded HTTP service that continues the trace via propagate.extract(), scores the EA's features with a fixed logistic model, and exports to the same OTLP collector. |
Warning: All rights to these materials are reserved by MetaQuotes Ltd. Copying or reprinting of these materials in whole or in part is prohibited.
This article was written by a user of the site and reflects their personal views. MetaQuotes Ltd is not responsible for the accuracy of the information presented, nor for any consequences resulting from the use of the solutions, strategies or recommendations described.