

From Option Chain to 3D Volatility Surface in MetaTrader 5
 1 164
1 164
 2
2

Introduction
If you trade options, you already live inside the implied-volatility surface. You know that a 25-delta put trades richer than a 25-delta call, that front-month gamma is priced differently from back-month, and that the shape of the smile is where the market hides its fear. MetaTrader 5 provides the components needed to reconstruct the surface. It offers option symbols (with strikes, expiries, and rights), an API to read symbol properties, and a built-in DirectX layer for rendering. What it leaves to us, as any charting platform does, is the last mile, assembling those per-contract numbers into a single three-dimensional object and putting it on the screen. That last mile is what we build here.
In this article we build an indicator that reads an option chain from either native MT5 option symbols or a CSV file. It converts quotes to implied volatilities, places them on a strike-by-expiry grid, and renders a shaded, rotatable 3D surface using MetaTrader's built-in DirectX layer. This is a practical tool for daily use. Once attached, it shows the skew and term structure computed from your own quotes. Options material for the platform is relatively sparse, so a live, rotatable 3D volatility surface running inside the terminal is a genuinely useful addition, which is part of why the project is worth walking through in full.
The build has three real parts, and we give each its due. First the numerics: turning an option's market price into an implied volatility is a root-finding problem, and doing it robustly across deep in- and out-of-the-money strikes takes more than a naive Newton step. Then the data: collecting a messy chain into a clean, hole-free grid that a mesh can consume. Finally the graphics: building the mesh, colouring it, lighting it, and projecting 3D positions back to screen pixels so the axes can carry readable labels. By the end you will have a complete, working tool and understand every line of it.
We assume you know options. We will not spend pages defining implied volatility or the smile; we treat those as shared vocabulary and move quickly to how each piece is implemented in MQL5.
We will cover:
- What the Surface Tells Us, and What MT5 Gives Us
- From Price to Implied Volatility: The Black-Scholes Core
- Building the Surface Grid
- Two Ways to Feed It: CSV and Native Options
- Rendering the Surface in 3D with DirectX
- Running the Tool
- Conclusion
What the Surface Tells Us, and What MT5 Gives Us
The implied-volatility surface is a function of two variables: strike (or moneyness) and time to expiry. Fix a strike and walk across expiries and you read the term structure; fix an expiry and walk across strikes and you read the skew or smile. The whole object is what our tool draws: strike on one horizontal axis, time to expiry on the other, implied volatility as height and colour. Three canonical shapes are worth keeping in mind because they are exactly what the rendered surface will show, and they are our visual sanity check that the pipeline is correct.

Fig. 1. The three shapes we render: equity-style skew, the smile, and how both flatten along the term-structure axis
Now to the building blocks: what does MetaTrader 5 expose for us to build this from? MT5 has first-class option symbols and describes them through the symbol properties API. The pieces we care about are:
- SYMBOL_OPTION_RIGHT tells us whether a contract is a call or a put (the ENUM_SYMBOL_OPTION_RIGHT value).
- SYMBOL_OPTION_STRIKE gives the strike price of the contract.
- SYMBOL_EXPIRATION_TIME gives the contract's expiry as a datetime.
- SYMBOL_BASIS names the underlying asset the option is written on, which is how we group a scattered symbol list into a single underlying's chain.
- SYMBOL_PRICE_VOLATILITY is, on some servers, a ready-made implied volatility for the contract, expressed as a percentage.
That last one is worth a note. When the server provides it, SYMBOL_PRICE_VOLATILITY saves us the inversion work, but it is broker-dependent: some servers publish it and some leave it at zero, and an account only carries option symbols if the broker offers options in the first place. So we treat it as a welcome shortcut rather than something to rely on, and we compute the volatility ourselves whenever it is absent. Either way, what these properties give us is a set of per-contract numbers; assembling them into a surface, from "turn a price into a volatility" to "arrange those volatilities into a shape you can see", is the work we do in the rest of this article.
The whole project is split along exactly those responsibilities. A pricing-and-inversion header does the Black-Scholes math. A data header defines the surface grid and the CSV provider. A second data header wraps the native MT5 option symbols. And the indicator itself owns the DirectX rendering. Each is a small, single-purpose file, and we take them in the order the data flows.
From Price to Implied Volatility: The Black-Scholes Core
Implied volatility is defined implicitly: it is the value of sigma that makes the Black-Scholes model price equal the observed market price. There is no closed form for it, so we compute the model price as a function of sigma and search for the sigma that reproduces the quote. That means we first need a clean Black-Scholes pricer, and for that we need the standard normal distribution. All of this lives in BlackScholes.mqh, a header of pure, stateless functions that both data providers share.
We start with the option right, defined to line up with MT5's own enumeration so the native provider can pass its value straight through without translation:
//+------------------------------------------------------------------+
//| Option right, matching MQL5's ENUM_SYMBOL_OPTION_RIGHT so both   |
//| data providers can pass the value straight through.              |
//+------------------------------------------------------------------+
enum ENUM_OPT_RIGHT
  {
   OPT_CALL = 0,   // right to buy
   OPT_PUT  = 1    // right to sell
  };
The Black-Scholes formula needs the cumulative normal distribution. We implement it directly rather than reach for the statistics library, so the inversion loop stays a self-contained numerical core that both providers can share without extra dependencies. The Abramowitz & Stegun 7.1.26 approximation of the error function is accurate to about 1e-7, which is far tighter than the noise on any real option quote, and it is a handful of multiplications with no branching to speak of:
//+------------------------------------------------------------------+
//| Standard normal CDF, via the Abramowitz & Stegun 7.1.26          |
//| approximation of erf. Accurate to about 1e-7, far tighter than   |
//| option-quote noise.                                              |
//+------------------------------------------------------------------+
double NormCDF(const double x)
  {
   double t = 1.0 / (1.0 + 0.2316419 * MathAbs(x));
   double d = 0.3989422804014327 * MathExp(-x * x / 2.0);   // 1/sqrt(2pi) * e^(-x^2/2)
   double p = d * t * (0.319381530 + t * (-0.356563782 + t * (1.781477937 + t * (-1.821255978 + t * 1.330274429))));
   return((x > 0.0) ? 1.0 - p : p);
  }
The probability density function is even simpler, and we will need it for vega:
//+------------------------------------------------------------------+
//| Standard normal PDF.                                             |
//+------------------------------------------------------------------+
double NormPDF(const double x)
  {
   return(0.3989422804014327 * MathExp(-x * x / 2.0));
  }
With those in hand, the pricer is the textbook Black-Scholes formula for a European option, written to accept a continuous carry yield q alongside the risk-free rate r so it works for dividend-paying underlyings and for the general cost-of-carry case. The one guard worth noting is at the top: at or past expiry, or for a non-positive volatility, the option is worth exactly its intrinsic value, and we return that directly rather than dividing by zero inside the d1 term.
//+------------------------------------------------------------------+
//| Black-Scholes price of a European option.                        |
//|   S     spot price of the underlying                             |
//|   K     strike price                                             |
//|   r     risk-free rate (annual, continuous)                      |
//|   q     dividend / carry yield (annual, continuous)              |
//|   sigma volatility (annual)                                      |
//|   T     time to expiry in years                                  |
//+------------------------------------------------------------------+
double BSPrice(const ENUM_OPT_RIGHT right, const double S, const double K,
               const double r, const double q, const double sigma, const double T)
  {
   if(T <= 0.0 || sigma <= 0.0)
     {
      //--- at/after expiry, value is pure intrinsic
      double intrinsic = (right == OPT_CALL) ? MathMax(S - K, 0.0) : MathMax(K - S, 0.0);
      return(intrinsic);
     }
   double sqrtT  = MathSqrt(T);
   double d1     = (MathLog(S / K) + (r - q + 0.5 * sigma * sigma) * T) / (sigma * sqrtT);
   double d2     = d1 - sigma * sqrtT;
   double disc_r = MathExp(-r * T);
   double disc_q = MathExp(-q * T);
   if(right == OPT_CALL)
      return(S * disc_q * NormCDF(d1) - K * disc_r * NormCDF(d2));
   else
      return(K * disc_r * NormCDF(-d2) - S * disc_q * NormCDF(-d1));
  }
To invert this by Newton-Raphson we need the derivative of price with respect to volatility, which is vega. It is also useful in its own right as a filter: when vega is tiny, the price barely responds to volatility, so the implied volatility is numerically meaningless and the solver should not trust a Newton step there. Same expiry guard as before:
//+------------------------------------------------------------------+
//| Vega (price sensitivity to a 1.00 change in sigma). Used both as |
//| the Newton step denominator and to reject near-worthless options |
//| whose IV is numerically meaningless.                             |
//+------------------------------------------------------------------+
double BSVega(const double S, const double K, const double r, const double q,
              const double sigma, const double T)
  {
   if(T <= 0.0 || sigma <= 0.0)
      return(0.0);
   double sqrtT = MathSqrt(T);
   double d1    = (MathLog(S / K) + (r - q + 0.5 * sigma * sigma) * T) / (sigma * sqrtT);
   return(S * MathExp(-q * T) * NormPDF(d1) * sqrtT);
  }
The Inversion Itself
Now the heart of the header. We want the sigma that makes BSPrice equal the market price. The naive approach is pure Newton-Raphson: guess a sigma, compute the price error, divide by vega, step, repeat. Newton converges fast when it works, but it is fragile precisely where option chains are messy. Deep in-the-money and deep out-of-the-money contracts have vanishing vega, so the Newton step divides by an almost-zero number and can hurl the estimate far outside any sensible range, sometimes never coming back.
We use a hybrid approach. We maintain a bracket [loVol, hiVol] that contains the solution and shrink it each iteration using the sign of the pricing error, which we can do because the Black-Scholes price is monotonically increasing in volatility. We use Newton's step when it stays within the bracket; otherwise we fall back to bisection, either because vega is too small to trust or because the step would jump outside the bracket. That combination is fast in the easy cases and robust in the hard ones. Before any of that, we reject quotes that cannot possibly correspond to a positive volatility: a price below intrinsic value has no valid implied vol, and we return a negative sentinel to flag it.
//+------------------------------------------------------------------+
//| Implied volatility by inverting the Black-Scholes price. Uses    |
//| Newton-Raphson (fast) and falls back to bisection whenever a     |
//| Newton step leaves the bracket, which keeps the solver robust for|
//| deep in/out-of-the-money quotes where vega is tiny.              |
//|                                                                  |
//| Returns the implied volatility, or a negative value if no valid  |
//| IV exists for the given inputs (e.g. price below intrinsic).     |
//+------------------------------------------------------------------+
double ImpliedVol(const ENUM_OPT_RIGHT right, const double price, const double S,
                  const double K, const double r, const double q, const double T)
  {
   if(price <= 0.0 || S <= 0.0 || K <= 0.0 || T <= 0.0)
      return(-1.0);

//--- price must sit above intrinsic value or no positive sigma solves it
   double intrinsic = (right == OPT_CALL) ? MathMax(S * MathExp(-q * T) - K * MathExp(-r * T), 0.0)
                      : MathMax(K * MathExp(-r * T) - S * MathExp(-q * T), 0.0);
   if(price < intrinsic - 1e-8)
      return(-1.0);

   double loVol = 1e-4, hiVol = 5.0;   // 0.01% .. 500% brackets the search
   double sigma = 0.2;                 // a sensible starting guess (20%)

   for(int i = 0; i < 100; i++)
     {
      double model = BSPrice(right, S, K, r, q, sigma, T);
      double diff  = model - price;
      if(MathAbs(diff) < 1e-6)
         return(sigma);

      //--- shrink the bracket using the sign of the error (price rises monotonically with sigma)
      if(diff > 0.0)
         hiVol = sigma;
      else
         loVol = sigma;

      double vega = BSVega(S, K, r, q, sigma, T);
      double next;
      if(vega > 1e-8)
         next = sigma - diff / vega;       // Newton step
      else
         next = 0.5 * (loVol + hiVol);     // vega too small: bisect

      //--- if Newton jumped outside the bracket, fall back to bisection
      if(next <= loVol || next >= hiVol)
         next = 0.5 * (loVol + hiVol);

      if(MathAbs(next - sigma) < 1e-8)
         return(next);
      sigma = next;
     }
   return(sigma);
  }
The loop caps at 100 iterations, which is far more than the hybrid ever needs in practice, but it guarantees termination even for pathological inputs. Two convergence tests short-circuit it: an absolute price error under 1e-6, and a step size under 1e-8 (the estimate has stopped moving). The animation below shows why the fallback matters: a Newton step from a low-vega region overshoots the bracket, and the bisection step reins it back in instead of letting the estimate escape.

Fig. 2. The hybrid solver: a Newton step overshoots the bracket in a low-vega region, and bisection recovers the search
Everything in this header is stateless and pure, which is deliberate. Both data providers, the CSV reader and the native-symbol reader, call ImpliedVol the same way, and neither has to know anything about the solver's internals. That is the seam that lets the rest of the system stay simple.
Building the Surface Grid
A raw chain is a flat, unordered list of quotes: this strike, that expiry, this price. A surface is a regular grid: sorted unique strikes along one axis, sorted unique expiries along the other, and one implied volatility in every cell. The job of IVSurfaceData.mqh is to turn the first thing into the second, and to do it in a way that leaves no holes, because the moment we hand this to a triangle mesh, a single empty cell is a tear in the surface.
A single quote, after inversion, is one small struct. The iv field is filled by whichever provider produced the quote, and it carries the same negative sentinel convention as ImpliedVol: a value at or below zero means "no valid volatility here".
//+------------------------------------------------------------------+
//| One raw option quote, before it is placed on the grid.           |
//+------------------------------------------------------------------+
struct OptionQuote
  {
   ENUM_OPT_RIGHT    right;
   double            strike;
   datetime          expiry;
   double            price;      // market mid price
   double            spot;       // underlying price
   double            rate;       // risk-free rate
   double            iv;         // filled in by the provider (-1 if invalid)
  };
The surface itself is a class that owns three arrays: the sorted strike axis, the sorted time axis (in years to expiry), and a flat row-major array of implied volatilities indexed as grid[t * nx + k]. It also tracks the spot and the min/max IV, which the renderer needs for colour and height scaling. Keeping the grid row-major and regular is exactly what lets the renderer walk it into a mesh without any interpolation of its own.
//+------------------------------------------------------------------+ //| The implied-volatility surface as a regular grid. Axes are the | //| sorted unique strikes (x) and times to expiry in years (y); each | //| cell holds implied vol, or a negative sentinel where no valid | //| quote existed. A regular grid is what lets the renderer hand it | //| straight to a triangle mesh. | //+------------------------------------------------------------------+ class CIVSurface { private: double m_strikes[]; // x axis, ascending double m_times[]; // y axis (years to expiry), ascending double m_iv[]; // row-major grid[t*nx + k], <0 = empty double m_spot; double m_ivMin, m_ivMax; // for colour/height scaling public: CIVSurface(void) : m_spot(0), m_ivMin(0), m_ivMax(0) {} int NStrikes(void) const { return(ArraySize(m_strikes)); } int NTimes(void) const { return(ArraySize(m_times)); } double Strike(const int i) const { return(m_strikes[i]); } double TimeYears(const int j) const { return(m_times[j]); } double Spot(void) const { return(m_spot); } double IVMin(void) const { return(m_ivMin); } double IVMax(void) const { return(m_ivMax); } double IV(const int j, const int k) const { return(m_iv[j * ArraySize(m_strikes) + k]); } bool Build(OptionQuote "es[]); void FillGaps(void); private: int IndexOf(const double &arr[], const double v) const; };
Build is a two-pass sweep. The first pass walks every valid quote and collects the unique strikes and the unique times to expiry, converting each expiry datetime into a fraction of a year from now. Invalid quotes (non-positive IV) and already-expired contracts are skipped so they never pollute the axes. Then we sort both axes and require at least a 2x2 grid, because you cannot draw a surface from a single row or column, and allocate the grid with every cell marked empty by the negative sentinel.
//+------------------------------------------------------------------+ //| Build the grid from a flat list of quotes. Collects the unique | //| strikes and expiries, places each valid IV in its cell, then | //| fills the holes left by missing or invalid quotes. | //+------------------------------------------------------------------+ bool CIVSurface::Build(OptionQuote "es[]) { int n = ArraySize(quotes); if(n == 0) return(false); datetime now = TimeCurrent(); if(now == 0) now = TimeLocal(); m_spot = quotes[0].spot; //--- collect unique sorted strikes and times ArrayResize(m_strikes, 0); ArrayResize(m_times, 0); for(int i = 0; i < n; i++) { if(quotes[i].iv <= 0.0) continue; // skip invalid quotes for axes double t = (double)(quotes[i].expiry - now) / (365.0 * 24 * 3600); if(t <= 0.0) continue; // expired if(IndexOf(m_strikes, quotes[i].strike) < 0) { int s = ArraySize(m_strikes); ArrayResize(m_strikes, s + 1); m_strikes[s] = quotes[i].strike; } if(IndexOf(m_times, t) < 0) { int s = ArraySize(m_times); ArrayResize(m_times, s + 1); m_times[s] = t; } } ArraySort(m_strikes); ArraySort(m_times); int nx = ArraySize(m_strikes), ny = ArraySize(m_times); if(nx < 2 || ny < 2) return(false); //--- allocate grid, mark all empty ArrayResize(m_iv, nx * ny); ArrayInitialize(m_iv, -1.0);
The second pass then walks the quotes once more, skips the same invalid and expired ones, looks up each quote's strike and time indices to address its cell, writes the implied volatility there, and tracks the running min and max IV as it goes. With the grid populated it calls FillGaps to close the holes and returns success. Both passes address a strike or time through the same small helper. Because strikes and times are floating-point values that have been through datetime arithmetic and division, we compare with a tolerance rather than for exact equality, so that a value which should be the same across two quotes actually matches:
//+------------------------------------------------------------------+
//| Linear search for a value in the array. Uses a small tolerance   |
//| so float round-trips still match.                                |
//+------------------------------------------------------------------+
int CIVSurface::IndexOf(const double &arr[], const double v) const
  {
   int n = ArraySize(arr);
   for(int i = 0; i < n; i++)
      if(MathAbs(arr[i] - v) < 1e-6)
         return(i);
   return(-1);
  }
Filling the Holes
After Build, the grid almost always has empty cells. A real chain does not quote every strike at every expiry, and some quotes fail inversion. Every one of those is a hole, and a mesh cannot render a hole. FillGaps closes them with a deliberately simple strategy: within each expiry row it does a forward pass that carries the last known volatility across gaps, then a backward pass that fills any leading gaps from the first known value, which together give linear hold across interior gaps and edge-extension at the ends. If an entire row is still empty (an expiry with no valid quotes at all), it copies the nearest fully-populated row wholesale. A final guard sets a sane default range if the whole surface came out empty.
This is intentionally not a volatility model. A real options desk would fit SABR or SVI and interpolate along a calibrated curve. Nearest-neighbour hold keeps the surface continuous without inventing structure that is not in the data, which is the honest choice for a visualization tool: what you see is your quotes, smoothed only enough to render, not a model's opinion of what the quotes should have been.
//+------------------------------------------------------------------+
//| Fill empty cells so the mesh has no holes. For each gap, take the|
//| nearest filled neighbours along the strike row (linear           |
//| interpolation / edge hold). Deliberately simple: a real desk     |
//| would fit a model (SABR, SVI), but nearest-neighbour keeps the   |
//| surface continuous without inventing structure.                  |
//+------------------------------------------------------------------+
void CIVSurface::FillGaps(void)
  {
   int nx = ArraySize(m_strikes), ny = ArraySize(m_times);
   for(int j = 0; j < ny; j++)
     {
      //--- forward pass: carry the last known value across gaps in this row
      double last = -1.0;
      for(int k = 0; k < nx; k++)
        {
         int idx = j * nx + k;
         if(m_iv[idx] > 0.0)
            last = m_iv[idx];
         else
            if(last > 0.0)
               m_iv[idx] = last;
        }
      //--- backward pass: fill any leading gaps from the first known value
      double next = -1.0;
      for(int k = nx - 1; k >= 0; k--)
        {
         int idx = j * nx + k;
         if(m_iv[idx] > 0.0)
            next = m_iv[idx];
         else
            if(next > 0.0)
               m_iv[idx] = next;
        }
     }
Those two passes handle every row with at least one valid quote. What is left is the harder case: an expiry row that came out entirely empty, with nothing to hold from in either direction. A second loop handles it by searching outward for the nearest fully-populated row and copying it wholesale, which extends the surface flatly into an expiry that had no data of its own. A closing guard sets a sane default IV range if the whole surface came out empty, so the renderer never divides by a zero span.

Fig. 3. Build and FillGaps: scattered quotes snap onto the strike-by-expiry grid, then the forward/backward passes close the holes
After this, g_surf is a fully populated grid with known min and max IV. That is precisely the contract the renderer expects, and everything downstream depends only on the public accessors, never on how the grid was filled.
Two Ways to Feed It: CSV and Native Options
The grid does not care where its quotes come from. That is the point of the OptionQuote struct: it is a common currency, and anything that can produce an array of them can feed the surface. We ship two producers. The CSV provider reads a chain file and works on any account, including one with no option symbols at all, which makes the tool runnable by everyone. The native provider reads the broker's own MT5 option symbols and is the primary path for an options-enabled account.
The CSV Provider
It lives in the same IVSurfaceData.mqh header and expects a comma-separated file in the terminal's MQL5\Files sandbox with a fixed column order: right, strike, expiry, mid, spot, rate. The right column is C or P, and the expiry is a YYYY.MM.DD date. Here is the head of the sample chain shipped with the project, an at-the-money-100 underlying with strikes from 70 to 130:
| right | strike | expiry | mid | spot | rate |
|---|---|---|---|---|---|
| P | 90.00 | 2026.07.13 | 0.0034 | 100.00 | 0.0450 |
| P | 95.00 | 2026.07.13 | 0.1099 | 100.00 | 0.0450 |
| C | 100.00 | 2026.07.13 | 1.3564 | 100.00 | 0.0450 |
| C | 105.00 | 2026.07.13 | 0.0803 | 100.00 | 0.0450 |
| P | 90.00 | 2026.08.05 | 0.2769 | 100.00 | 0.0450 |
The provider is a thin class with a single method. It opens the file as an ANSI CSV, reads the six fields row by row, skips the header line and any blank lines, and for each data row converts the strings into an OptionQuote. Crucially, it computes the implied volatility as it reads rather than in a separate pass, so the quotes it returns already have their iv filled.
//+------------------------------------------------------------------+
//| CSV provider. Reads a chain file from MQL5\Files with columns:   |
//|   right,strike,expiry,mid,spot,rate                              |
//| where right is C/P and expiry is YYYY.MM.DD. Computes IV for     |
//| each row via Black-Scholes inversion.                            |
//+------------------------------------------------------------------+
class CIVProviderCSV
  {
public:
   bool              Load(const string filename, OptionQuote &out[]);
  };

//+------------------------------------------------------------------+
//| Parse the CSV chain into a flat quote list, computing IV for     |
//| every row via Black-Scholes inversion as it is read.             |
//+------------------------------------------------------------------+
bool CIVProviderCSV::Load(const string filename, OptionQuote &out[])
  {
   int h = FileOpen(filename, FILE_READ | FILE_CSV | FILE_ANSI, ',');
   if(h == INVALID_HANDLE)
     {
      PrintFormat("CIVProviderCSV: cannot open %s (err %d)", filename, GetLastError());
      return(false);
     }
   ArrayResize(out, 0);
   bool header = true;
   while(!FileIsEnding(h))
     {
      string sRight  = FileReadString(h);
      if(FileIsLineEnding(h) && StringLen(sRight) == 0)
         continue;
      string sStrike = FileReadString(h);
      string sExpiry = FileReadString(h);
      string sMid    = FileReadString(h);
      string sSpot   = FileReadString(h);
      string sRate   = FileReadString(h);
      if(header)
        {
         header = false;   // skip the column titles
         continue;
        }
      if(StringLen(sStrike) == 0)
         continue;
The rest of the loop body is the string-to-struct conversion described above: it fills an OptionQuote from the six columns, decides the right by looking for a "P" in the upper-cased right field, computes the time to expiry, and calls ImpliedVol with a zero carry yield to fill the quote's iv before appending it to the output array. After the loop it closes the file, prints how many rows it loaded, and returns whether any quote survived.
The Native Provider
This is the path most options traders will use day to day: point it at an underlying and it builds the chain from your broker's live option symbols. It lives in its own header, IVProviderNative.mqh, and exposes the same shape of method, Load, so the indicator can swap providers without caring which one it holds. It also has a private helper to decide whether a given symbol is an option at all.
//+------------------------------------------------------------------+
//| Reads the broker's native MetaTrader 5 option symbols and        |
//| produces the same OptionQuote list the CSV provider does.        |
//+------------------------------------------------------------------+
class CIVProviderNative
  {
public:
   //--- underlying: base symbol (e.g. "SP" / "GAZP"); rate: risk-free
   bool              Load(const string underlying, const double rate, OptionQuote &out[]);

private:
   bool              IsOption(const string sym) const;
  };
The IsOption test is doing double duty. It asks the server for the symbol's option right, and if that call fails the symbol is not an option; brokers with no options support fail here for every symbol, so the same test also answers the question "does this account have options at all?". As a second confirmation it checks that the symbol carries a positive strike, since a genuine option always does.
//+------------------------------------------------------------------+
//| A symbol is an option if the server reports an option right for  |
//| it. Brokers that do not support options return an error / zero   |
//| here, so this doubles as the "options available?" test.          |
//+------------------------------------------------------------------+
bool CIVProviderNative::IsOption(const string sym) const
  {
   long right = 0;
   if(!SymbolInfoInteger(sym, SYMBOL_OPTION_RIGHT, right))
      return(false);
//--- options carry a valid strike; use it as a second confirmation
   double strike = SymbolInfoDouble(sym, SYMBOL_OPTION_STRIKE);
   return(strike > 0.0);
  }
The Load method enumerates every symbol the terminal knows about (passing false to SymbolsTotal so it sees the full list, not just Market Watch), keeps the ones that are options on the requested underlying, and turns each into a quote. The underlying match is by SYMBOL_BASIS, the property that names a derivative's base asset. For each matching contract it reads the strike, expiry and right, computes a mid price from the current bid and ask (falling back to the last price if either side is missing), and then decides the implied volatility: if the server publishes a SYMBOL_PRICE_VOLATILITY it uses that (dividing by 100, since the property is a percentage), otherwise it inverts the mid price through ImpliedVol. It counts how many contracts it found and how many came with server IV, and prints a clear diagnostic, including a specific message when nothing matched so the reason (an account without options, or an underlying whose name differs from SYMBOL_BASIS) is easy to spot.
//+------------------------------------------------------------------+
//| Enumerate all symbols, collect the options on the requested      |
//| underlying, and build one OptionQuote per contract.              |
//+------------------------------------------------------------------+
bool CIVProviderNative::Load(const string underlying, const double rate, OptionQuote &out[])
  {
   ArrayResize(out, 0);
   int total = SymbolsTotal(false);      // false = all symbols, not just Market Watch
   if(total <= 0)
     {
      Print("CIVProviderNative: no symbols available");
      return(false);
     }

   double spot = SymbolInfoDouble(underlying, SYMBOL_BID);
   if(spot <= 0.0)
      spot = SymbolInfoDouble(underlying, SYMBOL_LAST);

   datetime now = TimeCurrent();
   if(now == 0)
      now = TimeLocal();
   int found = 0, withServerIV = 0;

   for(int i = 0; i < total; i++)
     {
      string sym = SymbolName(i, false);
      if(!IsOption(sym))
         continue;

      //--- match the underlying via SYMBOL_BASIS (the derivative's base asset)
      string basis = SymbolInfoString(sym, SYMBOL_BASIS);
      if(basis != underlying)
         continue;

      //--- make sure the symbol's quotes are available
      SymbolSelect(sym, true);
The body of the loop then fills an OptionQuote for the contract exactly as the paragraph above describes: it reads the right, strike and expiry, takes the mid of the current bid and ask (falling back to the last price), and sets the iv from SYMBOL_PRICE_VOLATILITY divided by 100 when the server publishes one, otherwise from an ImpliedVol inversion. The withServerIV counter is bumped on the former branch so the diagnostic can report how many contracts came pre-priced, and the finished quote is appended to the output.
After the loop, the provider prints a diagnostic with the underlying, spot, the contract count and how many carried a server IV, and a specific note when nothing matched (the account may not offer options, or the underlying name may differ from SYMBOL_BASIS). Both providers end at the same place: an array of OptionQuote with implied volatilities filled in. Hand either one to CIVSurface::Build and you get the same grid. That interchangeability is what keeps the renderer, which is by far the biggest piece, completely ignorant of where the numbers came from.
Rendering the Surface in 3D with DirectX
Everything so far has produced a grid of numbers. The indicator, IVSurface3D.mq5, turns that grid into a shaded, lit, rotatable object using MetaTrader's built-in DirectX layer, the CCanvas3D class and the DX helper types that ship with the standard library. This is the largest part of the project, so we take it in the order the frame is built: setup, mesh, colour and lighting, camera, the label-projection trick, and the 2D overlay.
The indicator draws nothing on the price chart itself, so it declares zero plots and buffers, and includes the DX headers alongside our own data and provider headers:
#property indicator_chart_window
#property indicator_plots 0
#property indicator_buffers 0

#include <Canvas/Canvas3D.mqh>
#include <Canvas/DX/DXMesh.mqh>
#include <Canvas/DX/DXBox.mqh>
#include <IVSurface/IVSurfaceData.mqh>
#include <IVSurface/IVProviderNative.mqh>
The inputs let the user pick the data source and configure the native path. Note the light/dark theme toggle, which we resolve once into a small palette so the 3D clear colour and the 2D overlay stay consistent:
enum ENUM_IV_SOURCE
  {
   IV_SOURCE_CSV    = 0,   // read a chain CSV from MQL5\Files
   IV_SOURCE_NATIVE = 1    // enumerate the broker's MT5 option symbols
  };

input ENUM_IV_SOURCE InpSource     = IV_SOURCE_CSV;
input string         InpCsvFile    = "IVSurface\iv_chain_sample.csv";
input string         InpUnderlying = "";     // native: base symbol, empty = current chart symbol
input double         InpRiskFree   = 0.045;  // native: risk-free rate for IV inversion
input int            InpRefreshSec = 0;      // native: auto-refresh seconds (0 = manual R only)
input bool           InpLightTheme = true;   // light background (vs dark)
Geometry Scale and the Mesh
The surface is drawn inside a fixed world-unit box, so any chain, whatever its strike range or vol level, fits the same view. Three defines set that box, and the mesh-building code normalizes strike, time and IV into it.
//--- geometry scale of the surface in world units
#define SURF_W    3.2f     // strike axis span
#define SURF_D    3.2f     // time axis span
#define SURF_H    1.6f     // vol height span
The mesh is one vertex per grid cell. BuildMeshVertices walks the grid, and for each cell maps its strike to the x axis, its time to expiry to the z axis, and its implied volatility to both the y (height) axis and the vertex colour, each normalized into the box. The colour comes from a heat ramp, and the texture coordinates are set so lighting behaves; the normals are placeholders here because they are computed properly in a second pass once all positions are known.
//+------------------------------------------------------------------+
//| Build the surface mesh vertices from the current grid. x maps to |
//| strike, z to time-to-expiry, y (height) and colour to IV, each   |
//| normalized to the world-unit box so any chain fits the view.     |
//+------------------------------------------------------------------+
void BuildMeshVertices(void)
  {
   int nx = g_surf.NStrikes(), ny = g_surf.NTimes();
   int count = nx * ny;
   if(ArraySize(g_verts) != count)
      ArrayResize(g_verts, count);

   double kMin = g_surf.Strike(0),    kMax = g_surf.Strike(nx - 1);
   double tMin = g_surf.TimeYears(0), tMax = g_surf.TimeYears(ny - 1);
   double vMin = g_surf.IVMin(),      vMax = g_surf.IVMax();
   double kSpan = MathMax(kMax - kMin, 1e-9);
   double tSpan = MathMax(tMax - tMin, 1e-9);
   double vSpan = MathMax(vMax - vMin, 1e-9);

   for(int j = 0; j < ny; j++)
      for(int k = 0; k < nx; k++)
        {
         int i = j * nx + k;
         double iv = g_surf.IV(j, k);
         double vt = (iv - vMin) / vSpan;
         double x = ((g_surf.Strike(k) - kMin) / kSpan - 0.5) * SURF_W;
         double z = ((g_surf.TimeYears(j) - tMin) / tSpan - 0.5) * SURF_D;
         double y = (vt - 0.5) * SURF_H;
         g_verts[i].position = DXVector4((float)x, (float)y, (float)z, 1.0f);
         g_verts[i].normal   = DXVector4(0, 1, 0, 0);
         g_verts[i].tcoord   = DXVector2((float)k / (nx - 1), (float)j / (ny - 1));
         g_verts[i].vcolor   = HeatColor(vt);
        }
   RecomputeNormals();
  }
Those vertices are stitched into triangles by an index list, two triangles per grid cell, forming the solid surface. The index list depends only on the grid dimensions, so it is rebuilt only when the grid size changes:
//+------------------------------------------------------------------+
//| Two triangles per grid cell; the index list is static for a      |
//| given grid size, so we only rebuild it when the grid changes.    |
//+------------------------------------------------------------------+
void BuildMeshIndices(void)
  {
   int nx = g_surf.NStrikes(), ny = g_surf.NTimes();
   int cells = (nx - 1) * (ny - 1);
   ArrayResize(g_idx, cells * 6);
   int c = 0;
   for(int j = 0; j < ny - 1; j++)
      for(int k = 0; k < nx - 1; k++)
        {
         int i0 = j * nx + k, i1 = j * nx + k + 1, i2 = (j + 1) * nx + k, i3 = (j + 1) * nx + k + 1;
         g_idx[c++] = i0;
         g_idx[c++] = i2;
         g_idx[c++] = i1;
         g_idx[c++] = i1;
         g_idx[c++] = i2;
         g_idx[c++] = i3;
        }
  }
Colour
The heat ramp maps a normalized volatility in [0, 1] onto the classic blue-green-red scale: cool blue for the low-vol cells, hot red for the high-vol cells, green through the middle. It is a two-segment linear interpolation in RGB.
//+------------------------------------------------------------------+
//| Map a normalized value t in [0,1] to a blue->green->red ramp,    |
//| the classic "cool low vol, hot high vol" heat scale.             |
//+------------------------------------------------------------------+
DXColor HeatColor(double t)
  {
   if(t < 0.0)
      t = 0.0;
   if(t > 1.0)
      t = 1.0;
   double r, g, b;
   if(t < 0.5)
     {
      double u = t / 0.5;
      r = 0.1;
      g = 0.2 + 0.7 * u;
      b = 0.9 - 0.5 * u;
     }
   else
     {
      double u = (t - 0.5) / 0.5;
      r = 0.1 + 0.9 * u;
      g = 0.9 - 0.7 * u;
      b = 0.4 - 0.4 * u;
     }
   DXColor c;
   c.r = (float)r;
   c.g = (float)g;
   c.b = (float)b;
   c.a = 1.0f;
   return(c);
  }
Lighting
A lit surface needs per-vertex normals, and a smooth-shaded surface needs those normals averaged across the faces that meet at each vertex. RecomputeNormals does exactly that: it zeroes every normal, then for each triangle computes the face normal by a cross product of two edges and accumulates it onto all three of the triangle's vertices, and finally normalizes each accumulated vector. The result is smooth shading that follows the ridges and valleys of the surface, so the skew reads as a shape and not a flat sheet.
//+------------------------------------------------------------------+
//| Smooth per-vertex normals accumulated from adjacent faces, so    |
//| the lighting follows the ridges and valleys of the surface.      |
//+------------------------------------------------------------------+
void RecomputeNormals(void)
  {
   int count = ArraySize(g_verts);
   for(int i = 0; i < count; i++)
      g_verts[i].normal = DXVector4(0, 0, 0, 0);
   int tris = ArraySize(g_idx) / 3;
   for(int t = 0; t < tris; t++)
     {
      uint ia = g_idx[t * 3 + 0], ib = g_idx[t * 3 + 1], ic = g_idx[t * 3 + 2];
      DXVector3 a  = DXVector3(g_verts[ia].position.x, g_verts[ia].position.y, g_verts[ia].position.z);
      DXVector3 b  = DXVector3(g_verts[ib].position.x, g_verts[ib].position.y, g_verts[ib].position.z);
      DXVector3 cc = DXVector3(g_verts[ic].position.x, g_verts[ic].position.y, g_verts[ic].position.z);
      DXVector3 ab, ac, fn;
      DXVec3Subtract(ab, b, a);
      DXVec3Subtract(ac, cc, a);
      DXVec3Cross(fn, ab, ac);
That cross product fn is the face normal, and its length is proportional to the triangle's area, which gives the averaging a natural area weighting for free. The rest of the loop adds fn onto the running normal of all three of the face's vertices, and a final pass normalizes every accumulated vector back to unit length with DXVec3Normalize.
The Camera
The view orbits on a sphere around the surface's centre, parameterized by a yaw, a pitch and a distance, which the mouse handlers update. UpdateCamera converts those spherical coordinates into an eye position and points the camera at the origin.
//+------------------------------------------------------------------+
//| Place the camera from yaw/pitch/distance.                        |
//+------------------------------------------------------------------+
void UpdateCamera(void)
  {
   double cp = MathCos(g_camPitch), sp = MathSin(g_camPitch);
   double cy = MathCos(g_camYaw),   sy = MathSin(g_camYaw);
   DXVector3 eye;
   eye.x = (float)(g_camDist * cp * sy);
   eye.y = (float)(g_camDist * sp);
   eye.z = (float)(g_camDist * cp * cy);
   g_canvas.ViewPositionSet(eye);
   g_canvas.ViewTargetSet(DXVector3(0.0f, 0.0f, 0.0f));
   g_canvas.ViewUpDirectionSet(DXVector3(0.0f, 1.0f, 0.0f));
  }
Labels: Projecting 3D Back to 2D
Here is the single most useful trick in the renderer. CCanvas3D has no facility for drawing text in the 3D scene, so we cannot simply place "42%" at a point in space. Instead, we project a world position using the current view and projection matrices. We then perform the perspective divide and convert the normalized device coordinates into screen pixels. That gives us the exact pixel where a 3D point lands, and we draw the label there with the ordinary 2D text call. The function returns false when the point is behind the camera, so labels on the far side of the surface disappear instead of smearing across the screen.
//+------------------------------------------------------------------+
//| Project a world position to 2D screen pixels using the canvas's  |
//| current view and projection matrices. Returns false when the     |
//| point is behind the camera. This is the workhorse that lets us   |
//| draw axis tick numbers and titles that track the surface as the  |
//| camera orbits (CCanvas3D has no native 3D text).                 |
//+------------------------------------------------------------------+
bool WorldToScreen(const DXVector3 &world, int &sx, int &sy)
  {
   DXMatrix view, proj, vp;
   g_canvas.ViewMatrixGet(view);
   g_canvas.ProjectionMatrixGet(proj);
   DXMatrixMultiply(vp, view, proj);

   DXVector4 p = DXVector4(world.x, world.y, world.z, 1.0f), clip;
   DXVec4Transform(clip, p, vp);
   if(clip.w <= 1e-5)
      return(false);

   double ndcX = clip.x / clip.w;
   double ndcY = clip.y / clip.w;
   sx = (int)((ndcX * 0.5 + 0.5) * g_canvas.Width());
   sy = (int)((1.0 - (ndcY * 0.5 + 0.5)) * g_canvas.Height());
   return(true);
  }
Axis Labels and Colour Spines
DrawAxes3D is where that projection pays off. It draws numeric tick labels and a title along each of the three axes, and it decides which edge's labels are currently facing the camera so they never end up drawn over the front of the surface. The visibility test is the small block near the top: from the camera's yaw and pitch it works out which faces of the box are turned toward the viewer, and gates each axis's labels on that, so a label fades out as its edge rotates behind the surface rather than floating over it.
//+------------------------------------------------------------------+
//| Draw numeric tick labels along the three axes and an axis title  |
//| beside each, by projecting world positions to screen pixels. This|
//| gives the surface the labelled coordinate frame that turns it    |
//| from a floating blob into a readable chart.                      |
//+------------------------------------------------------------------+
void DrawAxes3D(void)
  {
   int nx = g_surf.NStrikes(), ny = g_surf.NTimes();
   double kMin = g_surf.Strike(0),    kMax = g_surf.Strike(nx - 1);
   double tMin = g_surf.TimeYears(0), tMax = g_surf.TimeYears(ny - 1);
   double vMin = g_surf.IVMin(),      vMax = g_surf.IVMax();
   uint  axisClr  = ColorToARGB(g_axisColor);
   uint  titleClr = ColorToARGB(g_textColor);
   int sx, sy;

   double ex = g_camDist * MathCos(g_camPitch) * MathSin(g_camYaw);
   double ez = g_camDist * MathCos(g_camPitch) * MathCos(g_camYaw);
   bool strikeVisible = (ez < 0.0);            // strike edge sits on the -Z face
   bool timeVisible   = (ex > 0.0);            // time edge sits on the +X face
   bool volVisible    = (ex < 0.0 || ez < 0.0); // vertical spine at the (-X,-Z) corner

   g_canvas.FontSet("Segoe UI", 12, FW_BOLD);

   if(strikeVisible)
     {
      double kStep = NiceStep(kMax - kMin, 6);
      for(double k = MathCeil(kMin / kStep) * kStep; k <= kMax + 1e-6; k += kStep)
        {
         DXVector3 w = DataToWorld(k, tMin, vMin);
         if(WorldToScreen(w, sx, sy))
            g_canvas.TextOut(sx, sy + 6, StringFormat("%.0f", k), axisClr, TA_CENTER);
        }
     }
The strike block shown here is the template for all three: pick a nice tick step, walk the axis from its rounded-up minimum to its maximum, and at each stop project a world position on the box edge down to a screen pixel and print the number there. The time and vol axes are the same three lines with their own coordinate driving the loop, printing %.2fy and %.0f%% labels respectively, each gated on its own timeVisible / volVisible flag. A second group of three blocks then places the axis titles, "Strike", "Time to Expiry" and "Implied Vol", at the midpoint of each edge under the same gates.
The tick spacing runs through a small "nice number" helper so the labels land on human-friendly values (10, 20, 50) instead of whatever raw step the range divided into:
//+------------------------------------------------------------------+
//| "Nice number" helper: round a raw step to 1/2/5 x 10^n so tick   |
//| labels land on human-friendly values.                            |
//+------------------------------------------------------------------+
double NiceStep(const double range, const int target)
  {
   double raw = range / MathMax(target, 1);
   double mag = MathPow(10, MathFloor(MathLog10(raw)));
   double n = raw / mag;
   double nice = (n < 1.5) ? 1 : (n < 3) ? 2 : (n < 7) ? 5 : 10;
   return(nice * mag);
  }
Alongside the labels, BuildAxisRods lays three thin coloured CDXBox spines along the same three edges the labels annotate: blue for strike, green for time, red for implied vol. They give each axis a colour key that reads at a glance, and a faint emission colour keeps them visible from any camera angle. These are the coloured rods running along the box edges in the rendered surface.
//+------------------------------------------------------------------+
//| Three thin coloured CDXBox rods running along the same three     |
//| edges the tick labels annotate, so each axis has a colour spine: |
//| blue = strike, green = time, red = implied vol. They double as a |
//| colour key next to the numeric labels.                           |
//+------------------------------------------------------------------+
bool BuildAxisRods(void)
  {
   float t = 0.014f;                                            // rod half-thickness
   float ox = -SURF_W * 0.5f, oy = -SURF_H * 0.5f, oz = -SURF_D * 0.5f; // the labelled corner
   CDXDispatcher *d = g_canvas.DXDispatcher();
   CDXInput      *s = g_canvas.InputScene();

   g_rodX = new CDXBox;
   g_rodY = new CDXBox;
   g_rodZ = new CDXBox;

//--- strike spine: along X at (min time, min vol) edge
   if(!g_rodX.Create(d, s, DXVector3(ox, oy - t, oz - t), DXVector3(ox + SURF_W, oy + t, oz + t)))
      return(false);
//--- implied-vol spine: up Y at (min strike, min time) edge
   if(!g_rodY.Create(d, s, DXVector3(ox - t, oy, oz - t), DXVector3(ox + t, oy + SURF_H, oz + t)))
      return(false);
//--- time spine: along Z at (max strike, min vol) edge (matches the labels)
   if(!g_rodZ.Create(d, s, DXVector3(ox + SURF_W - t, oy - t, oz), DXVector3(ox + SURF_W + t, oy + t, oz + SURF_D)))
      return(false);
Each rod is then given a diffuse colour (blue strike, red vol, green time) and a matching emission colour at 0.4 strength so it glows enough to read from any camera angle, and all three are handed to the canvas with ObjectAdd so they render as part of the scene.
The 2D Overlay
Because CCanvas3D inherits the ordinary 2D drawing calls of CCanvas, we can paint a flat overlay on top of the finished 3D frame, after the 3D render but before the frame is flushed to the chart. It draws three things: a title card, a colour legend, and a controls hint. The title card comes first:
//+------------------------------------------------------------------+
//| 2D overlay drawn on top of the finished 3D frame. Because        |
//| CCanvas3D inherits the 2D CCanvas drawing calls, we can paint a  |
//| title, an axis key, a colour legend for the implied-vol scale,   |
//| and a spot / range readout straight onto the same bitmap after   |
//| Render() but before Update() flushes it to the chart.            |
//+------------------------------------------------------------------+
void DrawOverlay(void)
  {
   DrawAxes3D();     // projected axis ticks + titles, under the panels
   int W = g_canvas.Width();
   uint txt = ColorToARGB(g_textColor);
   uint dim = ColorToARGB(g_textColor, 200);

//--- title card (top-left)
   int px = 12, py = 12, pw = 330, ph = 70;
   uint card   = ColorToARGB(g_panelColor, 235);                 // near-opaque card
   uint border = ColorToARGB(InpLightTheme ? (color)0xC4C8CE : (color)0x2E343C);
   uint header = ColorToARGB(InpLightTheme ? (color)0x2A2E33 : (color)0x3A4048);
   g_canvas.FillRectangle(px, py, px + pw, py + ph, card);
   g_canvas.Rectangle(px, py, px + pw, py + ph, border);              // crisp border
   g_canvas.FillRectangle(px, py, px + pw, py + 34, header);          // title bar
   g_canvas.FontSet("Segoe UI", 18, FW_BOLD);
   g_canvas.TextOut(px + 14, py + 7, "Implied Volatility Surface", ColorToARGB(clrWhite));
   g_canvas.FontSet("Segoe UI", 14);
   g_canvas.TextOut(px + 14, py + 44, StringFormat("spot %.2f       IV  %.1f%%  -  %.1f%%",
                    g_surf.Spot(), g_surf.IVMin() * 100.0, g_surf.IVMax() * 100.0), txt);
The card is a filled rectangle with a crisp border and a darker title bar, and two TextOut lines over it: the heading and a spot/IV-range readout formatted from the surface's own accessors. The other two panels follow the same 2D recipe. The vertical colour legend on the right edge fills a thin bar one pixel row at a time, running each row's normalized height back through HeatColor so the legend uses the exact same ramp as the surface, and labels its ends with the max and min IV. The controls hint is a single dimmed TextOut in the bottom-left corner.
Tying It Together in the Event Handlers
The scene is created once in OnInit (after the data loads), and each frame is rendered on a millisecond timer: clear the 3D buffers, render the meshes, draw the 2D overlay, flush. The timer body is short because all the work lives in the functions above.
//+------------------------------------------------------------------+
//| Timer tick: auto-refresh the native source, then render + flush  |
//| a fresh frame with the 2D overlay drawn on top.                  |
//+------------------------------------------------------------------+
void OnTimer(void)
  {
   if(InpSource == IV_SOURCE_NATIVE && InpRefreshSec > 0 &&
      TimeCurrent() - g_lastRefresh >= InpRefreshSec)
     { Reload(); g_lastRefresh = TimeCurrent(); }

   g_canvas.Render(DX_CLEAR_COLOR | DX_CLEAR_DEPTH, g_bgArgb);
   DrawOverlay();          // 2D title / legend / axis key on top of the 3D frame
   g_canvas.Update(true);
  }
Mouse and keyboard events drive the camera. A left-drag updates yaw and pitch (with the pitch clamped so the camera stays above the surface), the wheel scales the distance within limits, the R key reloads the data, and a chart resize rebuilds the DX scene at the new pixel size. There is real subtlety in the teardown order in OnDeinit, which the source comments in full: the chart bitmap object we created ourselves must be deleted before the canvas is destroyed, or the last frame stays stuck on the chart. The event handlers are all in the attached source; they are mechanical once the pieces above are understood.
Running the Tool
Compile IVSurface3D.mq5 and it appears under the project's IVSurface folder. Drop the sample iv_chain_sample.csv into the terminal's MQL5\Files\IVSurface folder (the path the InpCsvFile input defaults to), attach the indicator to any chart, and with the default inputs (InpSource = IV_SOURCE_CSV) it reads that chain and renders immediately. There is no dependency on having an options account: the CSV path is the "works for everyone" path, and it is the fastest way to confirm the whole pipeline end to end.
For live data, set InpSource to IV_SOURCE_NATIVE and put your underlying's base symbol in InpUnderlying (leave it empty to use the current chart symbol), then set InpRiskFree to a sensible rate for the inversion. On an options-enabled account the provider will enumerate the option symbols, match them to that underlying by SYMBOL_BASIS, and build the surface from live bid/ask. If you set InpRefreshSec above zero, the native source re-polls on that interval so the surface tracks the market; leave it at zero to refresh only when you press R.
The controls are the three listed in the overlay: left-drag to orbit, mouse wheel to zoom, and R to reload the data. The animation below shows the indicator being attached and driven on a chart.
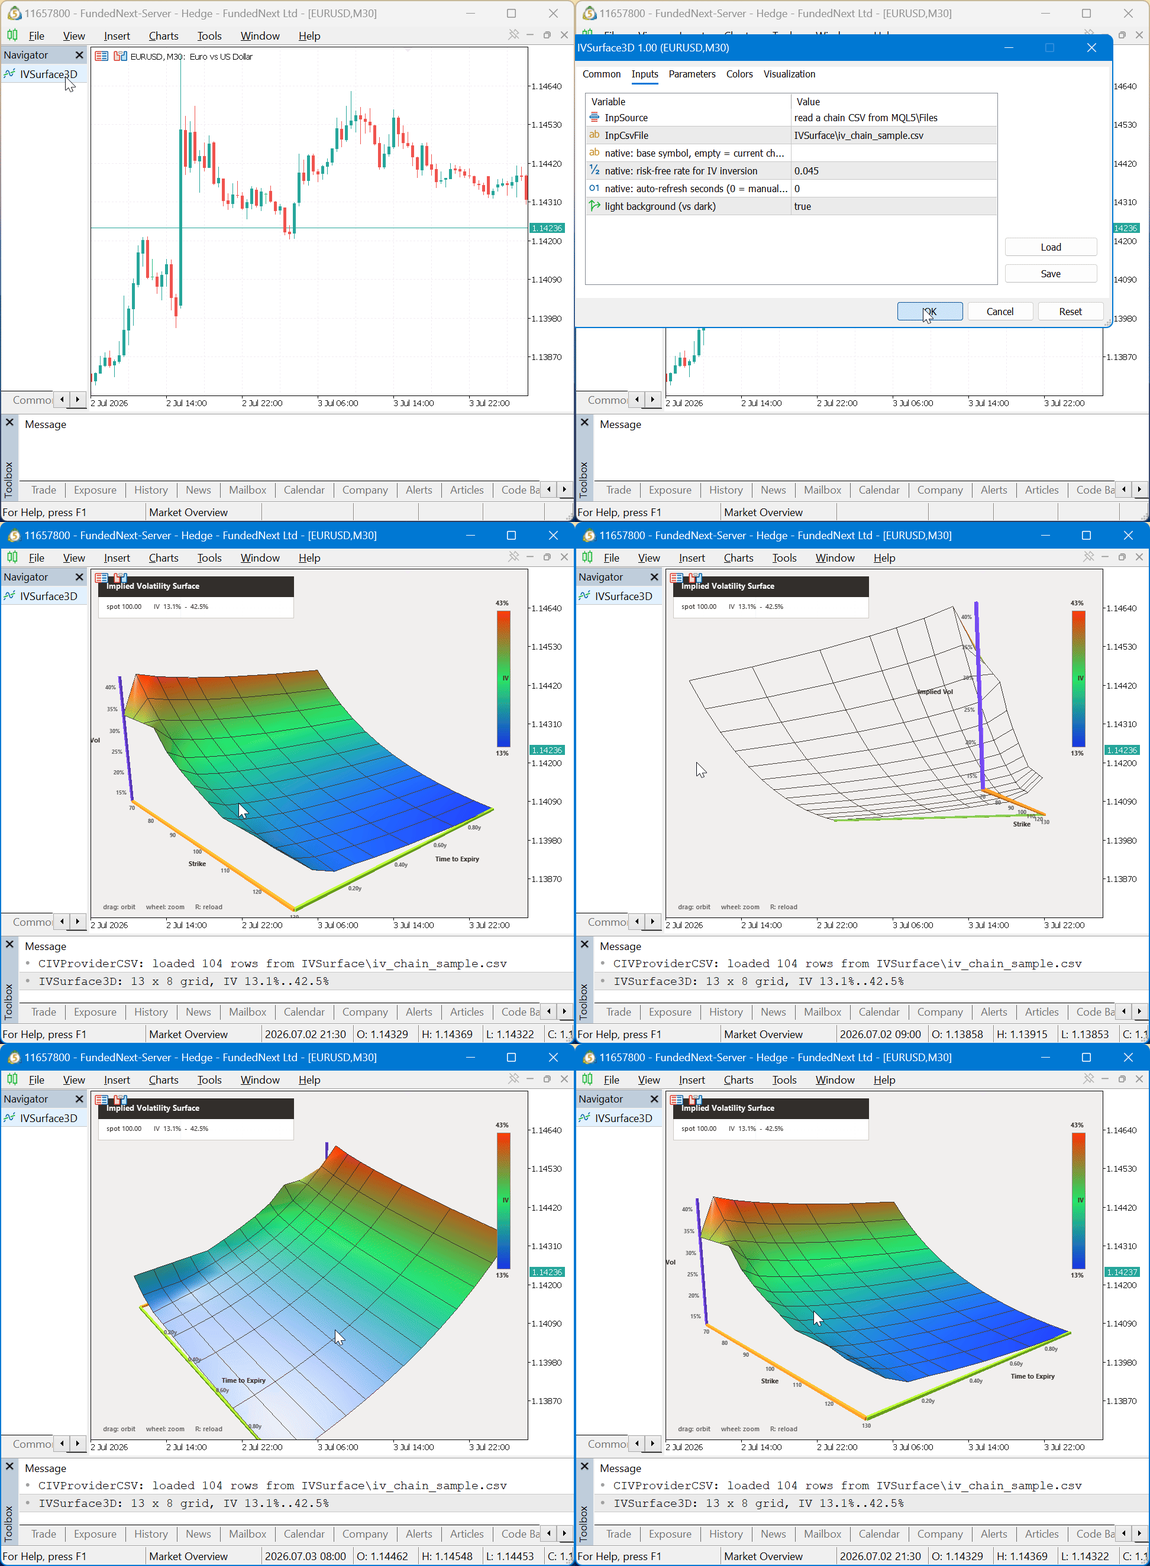
Fig. 4. The finished tool: attaching the indicator and orbiting the rendered implied-volatility surface
Reading the result is exactly the exercise an options trader already knows. On the sample chain (spot 100, strikes 70 to 130, expiries out to about eight months) the surface renders a clean, textbook skew: implied volatility is high, in the red, at the low strikes and falls away to the low blues at the high strikes, and that skew flattens as you move along the time-to-expiry axis into the longer-dated back of the surface. The title card reads the spot and the live IV range (on the sample, roughly 13% to 42%), and the vertical legend keys the colours to those numbers. If the shape you get from your own broker's chain looks like a plausible skew or smile with a sane term structure, the inversion and the grid are doing their job; if a whole region looks flat and wrong, that is usually the gap-fill honestly showing you where your chain had no quotes.
Conclusion
We set out to build something new for the platform: a live 3D implied-volatility surface, assembled from the per-contract numbers MetaTrader 5 provides and drawn with its own DirectX layer. We built it end to end, and walked every line of it.
- The numerics. A compact, stateless Black-Scholes core with an Abramowitz & Stegun normal CDF, and a robust implied-volatility inversion that combines fast Newton-Raphson with a bisection fallback so it stays stable across deep in- and out-of-the-money strikes where vega collapses.
- The data pipeline. A surface grid that collects a flat chain into sorted strike and expiry axes, drops each inverted quote into its cell, and fills the inevitable holes with a deliberately honest nearest-neighbour hold rather than a fitted model that would invent structure.
- Two interchangeable providers. A CSV reader that runs on any account, and a native provider that builds the chain from the broker's own MT5 option symbols, preferring the server's implied volatility where it exists and inverting the mid price where it does not, both emitting the same quote struct.
- The renderer. A full DirectX surface built with CCanvas3D: a coloured, smooth-lit triangle mesh, an orbiting camera, a 3D-to-2D projection trick that lets us label axes the scene cannot natively draw, and a 2D overlay for the title, legend and controls.
The tool is deliberately a visualizer, not a pricing model, and it is honest about that. The gap-fill is nearest-neighbour, not SABR or SVI, so flat regions are exactly the places your chain had no quotes rather than a model's guess. There is no smoothing of live-tick noise, and the inversion uses a single flat risk-free rate rather than a full discount curve. Each of those is a natural next step: a calibrated SVI or SABR fit would give a genuinely smooth, arbitrage-aware surface; a Greeks overlay would turn the same mesh into a delta or vega map; and per-expiry discounting would sharpen the front-month inversion. The architecture is built to absorb them, because the renderer only ever talks to the grid through its public accessors, so a better surface model slots in without touching a line of the graphics code.
The programs presented in this article are intended for educational purposes only. Options involve substantial risk and are not suitable for every investor. Nothing here is trading advice, and the implied volatilities shown are only as good as the quotes fed to the tool.
Getting the Source Code via MQL5 Algo Forge
All source files are attached to this article below, but the full repository is also available on MQL5 Algo Forge, the community's Git-based platform for sharing and collaborating on trading projects.
| File name | Description |
|---|---|
| MQL5\Include\IVSurface\BlackScholes.mqh | Black-Scholes pricing (call/put with carry), normal CDF/PDF, vega, and the Newton-Raphson-with-bisection implied-volatility inversion |
| MQL5\Include\IVSurface\IVSurfaceData.mqh | The OptionQuote struct, the CIVSurface grid (Build + FillGaps), and the CSV chain provider |
| MQL5\Include\IVSurface\IVProviderNative.mqh | Native MT5 option-symbol provider: enumerates symbols, matches the underlying by SYMBOL_BASIS, and reads or computes implied volatility |
| MQL5\Indicators\IVSurface\IVSurface3D.mq5 | The 3D DirectX indicator: mesh building, heat colouring, lighting, orbit camera, 3D-to-2D axis labels, and the 2D overlay |
| MQL5\Files\IVSurface\iv_chain_sample.csv | Sample option chain (spot 100, strikes 70-130, multiple expiries) that renders a textbook skew with no options account required |
Warning: All rights to these materials are reserved by MetaQuotes Ltd. Copying or reprinting of these materials in whole or in part is prohibited.
This article was written by a user of the site and reflects their personal views. MetaQuotes Ltd is not responsible for the accuracy of the information presented, nor for any consequences resulting from the use of the solutions, strategies or recommendations described.

 N-BEATS Network-Based Forex EA
 Interactive Supply and Demand Zone Manager in MQL5 (Part III): Zone Analysis, Stateful Interaction, and Pending Event Management
 Exponentially Weighted Covariance Matrix in MQL5: Building an Adaptive Correlation Monitor for Multi-Symbol EAs
 Persistence Entropy as a Market Regime Indicator in MQL5

- Free trading apps
- Over 8,000 signals for copying
- Economic news for exploring financial markets
You agree to website policy and terms of use
Thanks for this ,it was really helpful
Thanks for this ,it was really helpful