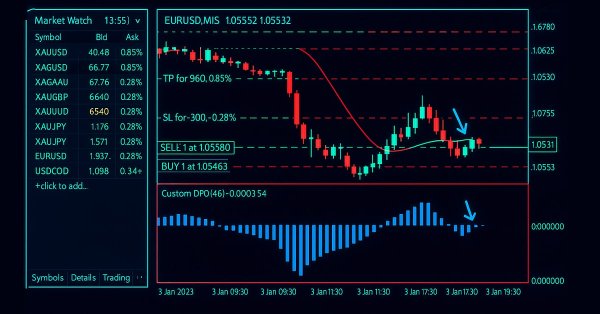
How to build and optimize a cycle-based trading system (Detrended Price Oscillator - DPO)
In this article, we will introduce a new concept by examining a technical indicator and evaluating its potential usefulness within trading systems. Our focus will be on the Detrended Price Oscillator (DPO).
The aim of this series of articles is to share practical tools that can be used either as standalone techniques or as components of a broader trading system. We aim to help you continuously improve your trading performance by building, testing, and optimising these tools. However, you must thoroughly test each method to determine whether it is suitable for your trading style and adds real value. I would also like to offer some advice. If you want to improve your coding skills, it is crucial to apply what you learn. Try to code independently and test what you have learnt as much as possible, as this will help you to benefit most from the topic you are studying.
We will cover the Detrended Price Oscillator (DPO) in the following topics:
- Detrended Price Oscillator (DPO) definition: By learning as much as possible about the definition and calculation method of this technical tool, we will gain a clear understanding of it.
- Custom Detrended Price Oscillator (DPO) indicator: The learning process for coding a custom indicator involves the modification of the indicator or the application of one's own preferences.
- Detrended Price Oscillator (DPO) strategies: We will explore simple Detrended Price Oscillator (DPO) strategies that can be incorporated into our trading system, with a view to enhancing our understanding of how to apply them.
- Detrended Price Oscillator (DPO) trading system: The building, backtesting, and optimization of these simple trading systems will be carried out.
- Conclusion
Detrended Price Oscillator (DPO) definition
The Detrended Price Oscillator (DPO) is a tool that can be used to highlight price cycles. This is done through filtering out long-term trends. It focuses on short-term price cycles. The identification of overbought or oversold conditions and the location of turning points is possible with the use of this indicator.
The (DPO) indicator compares the current price to a moving average. This moving average is shifted back in time. This is to isolate shorter cycles. The period of the moving average is typically chosen based on the cycle length. The DPO is an oscillator indicator as it oscillates above and below zero, and this gives good insights, as reading positive values indicates that the price is trading above its shifted average, while negative values indicate that the price is below it.
This indicator can be used to detect cyclical highs and lows, as well as to time entries and exits. It can also be used in conjunction with other tools to enhance generated signals.
If you are interested in the calculation method of such an indicator, you can follow the steps below:
- Choose the DPO period (N).
- Calculate the SMA (simple moving average) for the period determined in step 1.
SMA = (Price1 + Price 2 + ....) / N
- Shift the SMA (Simple Moving Average to the left by half of the period plus one.
Shift = (N/2)+1
- Subtract the shifted SMA from the price.
Today's DPO = Today's Price - Today's SMA (shifted back by shift)
Custom Detrended Price Indicator (DPO)
In this section, we will provide the code for this DPO indicator step by step. We will also build our own simple custom version to incorporate the features and preferences that we will need for our trading system. This will give you an idea of the features and preferences that you can add to your own system.
The subsequent steps will elucidate the methodology by which we can code this bespoke DPO line, line by line:
First, we will specify the indicator description using the preprocessor #property, and then we will specify the identifier value.
#property description "Custom Detrended Price Oscillator"
Use the preprocessor #include to include the MQH file of moving averages, specifying the file name as it appears in the include file. This will allow us to use it later in our code.
#include <MovingAverages.mqh> Specify the desired location (indicator_separate_window) for displaying the indicator as part of the settings using the #property.
#property indicator_separate_windowThe number of buffers for indicator calculation by using the (indicator_buffers) constant, we set it to 2.
#property indicator_buffers 2
The number of graphic series in the indicator by using (indicator_plots) constant, we set it to 1.
#property indicator_plots 1
The indicator label is set by using indicator_labelN to set the label string as "DPO"
#property indicator_label1 "DPO"
The indicator type is set by using the indicator_typeN to set the type of graphical plotting, which we will use as DRAW_HISTOGRAM
#property indicator_type1 DRAW_HISTOGRAM
The color of the displayed graph by using the indicator_colorN, which will be clrRoyalBlue
#property indicator_color1 clrRoyalBlue
The width or thickness of the plotted graph is determined by using indicator_widthN, which will be 2
#property indicator_width1 2
Adding the zero level to be displayed by using the indicator_levelN
#property indicator_level1 0
By using the input function, we will declare an integer variable for the DPO indicator to be specified by the user as per preferences, and we will set 20 as a default value
input int detrendPeriodInp=20; // Period
Declaring two double arrays of dpoBuffer and maBuffer, and another integer of maPeriod
double    dpoBuffer[];
double    maBuffer[];
int       maPeriod;
In the OnInit() section, we will define the initialization function for the DPO. When the indicator is loaded onto the chart, this function will run automatically once.
void OnInit()
{

}
Inside this OnInit() function, we will define the variable of maPeriod, which will define the cycle length to be used for smoothing in the DPO
maPeriod=detrendPeriodInp/2+1;
Store and display the DPO and MA values as buffers.
   SetIndexBuffer(0,dpoBuffer,INDICATOR_DATA);
   SetIndexBuffer(1,maBuffer,INDICATOR_CALCULATIONS);
Use the IndicatorSetInteger to set the number of decimal places or digits for the DPO, its parameters:
- prop_id: to define an integer value as an identifier of the indicator property, which is the (INDICATOR_DIGITS).
- prop_value: to define the value of the property, which is (_Digits) to set the symbol's digits plus 1.
IndicatorSetInteger(INDICATOR_DIGITS,_Digits+1);
Use the PlotIndexSetInteger to set the first bar to start drawing, its parameters:
- plot_index: define the plotting index, which is 0.
- prop_id: define the property identifier, which is (PLOT_DRAW_BEGIN).
- prop_value: define the value to be set, which is (maPeriod-1).
PlotIndexSetInteger(0,PLOT_DRAW_BEGIN,maPeriod-1);
Declare a string variable (indShortName) to define the short indicator name that will be displayed on the indicator by using StringFormat with two parameters (the name of the indicator) and (the period of the indicator as per the user input).
string indShortName=StringFormat("Custom DPO(%d)",detrendPeriodInp);Set the defined name by using IndicatorSetString with two parameters (the property identifier, which is INDICATOR_SHORTNAME, and the string property value, which is the defined name).
IndicatorSetString(INDICATOR_SHORTNAME,indShortName);
The OnCalculate function to calculate the indicator
int OnCalculate(const int rates_total,
                const int prev_calculated,
                const int begin,
                const double &price[])
  {

  }
Inside the OnCalculate function, we declare an integer variable named start. Declare and define another one named index1 to be equal to (begin+maPeriod-1)
   int start;
   int index1=begin+maPeriod-1;
Handling the initialization and setting where calculations should start, if the first calculation is true correct:
- Use (ArrayInitialize) to initialize the array by zero
- Update start variable to be equal to index1
- If begin is greater than 0, set the value of the corresponding property of the corresponding indicator line by using (PlotIndexSetInteger)
otherwise, we will update the start variable to be equal to (prev_calculated-1)
   if(prev_calculated<index1)
     {
      ArrayInitialize(dpoBuffer,0.0);
      start=index1;
      if(begin>0)
         PlotIndexSetInteger(0,PLOT_DRAW_BEGIN,index1);
     }
   else
      start=prev_calculated-1;
Calculate the simple moving average by using the defined function (SimpleMAOnBuffer), which is included in the MovingAverages.mqh file
SimpleMAOnBuffer(rates_total,prev_calculated,begin,maPeriod,price,maBuffer);
Create a loop for the calculation that loops through each bar from start to rates_total to define the dpoBuffer[i] until the indicator is removed or the terminal shuts down
for(int i=start; i<rates_total && !IsStopped(); i++)
   dpoBuffer[i]=price[i]-maBuffer[i];
Return the new value after OnCalculate is done
return(rates_total); This is the full code for the custom DPO indicator, as we can put it in one block of code as below
//+------------------------------------------------------------------+
//|                                                    customDPO.mq5 |
//+------------------------------------------------------------------+
#property description "Custom Detrended Price Oscillator"
#include <MovingAverages.mqh>
#property indicator_separate_window
#property indicator_buffers 2
#property indicator_plots   1
#property indicator_label1 "DPO"
#property indicator_type1   DRAW_HISTOGRAM
#property indicator_color1  clrRoyalBlue
#property indicator_width1  2
#property indicator_level1 0
input int detrendPeriodInp=20; // Period
double    dpoBuffer[];
double    maBuffer[];
int       maPeriod;
//+------------------------------------------------------------------+
//| Custom indicator initialization function                         |
//+------------------------------------------------------------------+
void OnInit()
  {
   maPeriod=detrendPeriodInp/2+1;
   SetIndexBuffer(0,dpoBuffer,INDICATOR_DATA);
   SetIndexBuffer(1,maBuffer,INDICATOR_CALCULATIONS);
   IndicatorSetInteger(INDICATOR_DIGITS,_Digits+1);
   PlotIndexSetInteger(0,PLOT_DRAW_BEGIN,maPeriod-1);
   string indShortName=StringFormat("Custom DPO(%d)",detrendPeriodInp);
   IndicatorSetString(INDICATOR_SHORTNAME,indShortName);
  }
//+------------------------------------------------------------------+
//| Detrended Price Oscillator                                       |
//+------------------------------------------------------------------+
int OnCalculate(const int rates_total,
                const int prev_calculated,
                const int begin,
                const double &price[])
  {
   int start;
   int index1=begin+maPeriod-1;
   if(prev_calculated<index1)
     {
      ArrayInitialize(dpoBuffer,0.0);
      start=index1;
      if(begin>0)
         PlotIndexSetInteger(0,PLOT_DRAW_BEGIN,index1);
     }
   else
      start=prev_calculated-1;
   SimpleMAOnBuffer(rates_total,prev_calculated,begin,maPeriod,price,maBuffer);
   for(int i=start; i<rates_total && !IsStopped(); i++)
      dpoBuffer[i]=price[i]-maBuffer[i];
   return(rates_total);
  }
//+------------------------------------------------------------------+
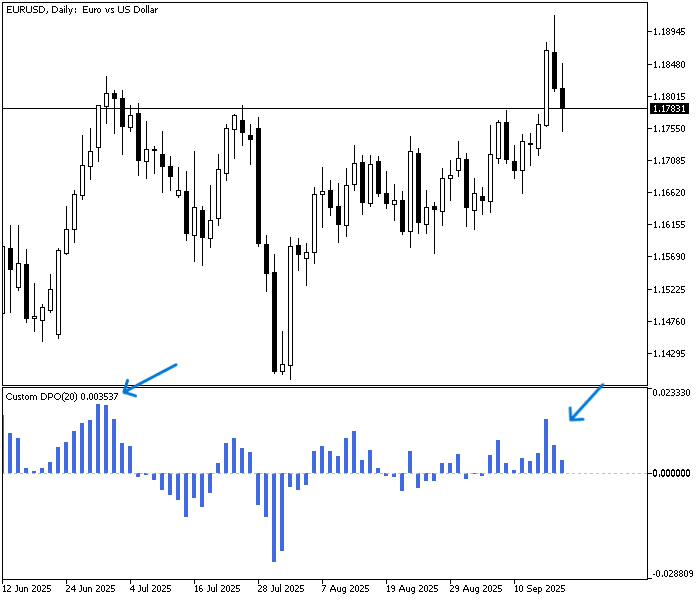
After compiling the code without any errors, we can find it the same as below when inserting into the chart:
Detrended Price Indicator (DPO) Strategies
In this section, we will provide simple strategies for building this trading system using DPO, and they are the same as the ones below:
- DPO Zero Crossover strategy.
- DPO Trend Validation strategy.
The DPO Zero Crossover strategy:
This strategy is placing buy and sell positions based on the crossover between the DPO value and the Zero level. The buy position places when the previous DPO value is below 0 and the current one is above 0, and the sell position places when the previous DPO value is above 0 and the current one is below the zero level.
Simply,
The previous DPO Val < 0 and the current DPO Val > 0 --> Buy
The previous DPO Val > 0 and the current DPO Val < 0 --> Sell
The DPO Trend Validation strategy:
This strategy is placing buy and sell positions based on the crossover between the moving average and the crossover between the DPO value and the zero level to validate the DPO zero crossover especially with the short-term signal for optimization purposes. So, the buy position will be placed when the closing price is less than the previous moving average value, the current bar ask price is greater than the current moving average value and the DPO value is above 0. While the sell position will be placed when the closing price is greater than the previous moving average value, the current bar bid price is less than the current moving average value and the DPO value is below 0.
Simply,
The Close < Previous MA Value and Ask > MA Value and DPO Value > 0 --> Buy
The Close > Previous MA Value and Bid < MA Value and DPO Value < 0 --> Sell
We will code, test, and optimise each of these strategies, trying out different concepts to achieve the best possible results. We'll explore this in more detail in the next section.
Detrended Price Indicator (DPO) Trading System
In this section, we will present how to create automated DPO-based trading systems based on the mentioned strategies. We will see that step-by-step to understand how this system can work, and you can consider this as a base for new insights and concepts to optimize more, and this is the main objective of this type of article. First, we will code a simple EA to show us the DPO values on the chart to use it a base for all EAs of the trading system that we will create.
Next, we will configure the Expert Advisor (EA) input to specify the desired period to be used when calling the indicator.
input int period=20; // Period
Declare an integer variable for dpo
int dpo; In the OnInit() event, we will initialize our custom DPO indicator by calling the iCustom function. Its parameters are as follows:
- Symbol: The symbol name as a string. Here, we use _Symbol to apply it to the current chart symbol.
- Period: The timeframe as an ENUM_TIMEFRAMES. We use PERIOD_CURRENT to apply it to the current chart timeframe.
- Name: The name of the custom indicator, including the correct path on the local machine (written as folder/custom_indicator_name), in our case, the name of the indicator (customDPO).
- Inputs: A list of the indicator's input parameters, if applicable. Here, it is the (period).
We then use the INIT_SUCCEEDED return value to confirm successful initialization and proceed to the next part of the code.
int OnInit()
  {
   dpo = iCustom(_Symbol,PERIOD_CURRENT,"customDPO",period);
   return(INIT_SUCCEEDED);
  }
In the OnDeinit() event, we will specify that the message of EA is removed when the deinitialization event occurs.
void OnDeinit(const int reason)
  {
   Print("EA is removed");
  }
In the OnTick() event, which is called in EAs when a new tick event occurs
void OnTick()
  {

  }
We will declare an array for the dpoInd[] as a double data type
double dpoInd[]; Retrieve data from the specified DPO indicator buffer using the CopyBuffer function. Its parameters are:
- indicator_handle: The handle of the DPO indicator.
- buffer_num: The buffer number to copy from; 0 for the DPO indicator.
- start_pos: The starting position, set here to 0.
- count: The number of values to copy; in this case, 3.
- buffer[]: The target array where the copied values will be stored (here dpoInd[]).
CopyBuffer(dpo,0,0,3,dpoInd);
Set the AS_SERIES flag for the dpoInd[ ] array to index its elements as a time series. Use the array name and flag value (true) as parameters; the function will return true if successful.
ArraySetAsSeries(dpoInd,true);
Declare and define a double variable for the dpoVal to return the current dpo index and normalize it to 3 digits.
double dpoVal = NormalizeDouble(dpoInd[0], 3);
Comment the value of the current DPO on the chart
comment("DPO value = ",dpoVal); The full code in one block can be the same as below
//+------------------------------------------------------------------+
//|                                                      DPO_Val.mq5 |
//+------------------------------------------------------------------+
input int                 period=20; // Period
int dpo;
int OnInit()
  {
   dpo = iCustom(_Symbol,PERIOD_CURRENT,"customDPO",period);
   return(INIT_SUCCEEDED);
  }
void OnDeinit(const int reason)
  {
   Print("EA is removed");
  }
void OnTick()
  {
    double dpoInd[];
    CopyBuffer(dpo,0,0,3,dpoInd);
    ArraySetAsSeries(dpoInd,true);
    double dpoVal = NormalizeDouble(dpoInd[0], 3);
    Comment("DPO value = ",dpoVal);
  }
After compiling without any errors and attaching the EA, we can see the DPO value as a dynamic comment on the chart, the same as below:
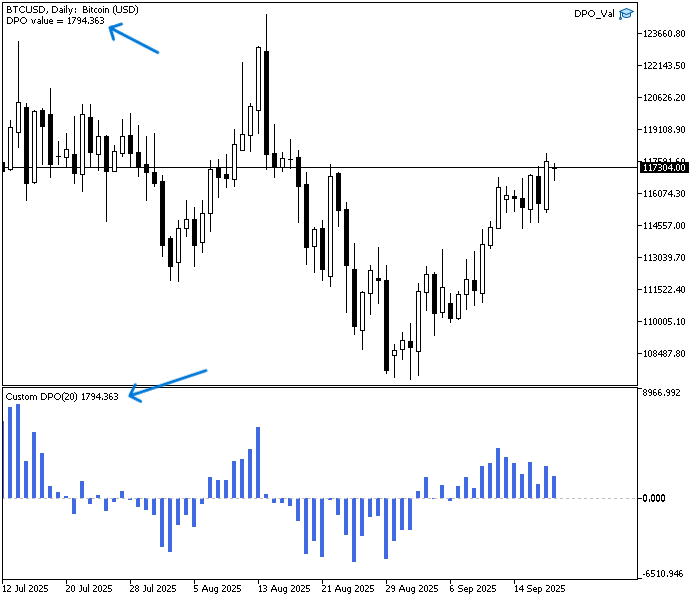
As you can see, the DPO value on the chart is the same as the value shown on the inserted indicator (1794.363). We can use this as a basis for other Expert Advisors (EAs) of strategies.
The DPO Zero Crossover strategy:
As we mentioned, the logic behind this strategy is that we need to code an EA that can place orders automatically, which is the zero crossover of the DPO indicator. We need to program to check every tick where is the DPO current and previous values and compare them to the zero level. When the previous value is less than zero them the current cross above the zero we need the program to place a buy order. The sell order will be placed when the previous DPO value is above zero and the current is below.
The below is the full code of this type of program that can be run on the MetaTrader 5:
//+------------------------------------------------------------------+
//|                                           DPO_Zero_Crossover.mq5 |
//+------------------------------------------------------------------+
#include <trade/trade.mqh>
input int                 period=20; // Periods
input double      lotSize=1;
input double      slLvl=300;
input double      tpLvl=900;
int dpo;
CTrade trade;
int barsTotal;
int OnInit()
  {
   barsTotal=iBars(_Symbol,PERIOD_CURRENT);
   dpo = iCustom(_Symbol,PERIOD_CURRENT,"customDPO",period);
   return(INIT_SUCCEEDED);
  }
void OnDeinit(const int reason)
  {
   Print("EA is removed");
  }
void OnTick()
  {
   int bars=iBars(_Symbol,PERIOD_CURRENT);
   if(barsTotal != bars)
     {
      barsTotal=bars;
      double dpoInd[];
      CopyBuffer(dpo,0,0,3,dpoInd);
      ArraySetAsSeries(dpoInd,true);
      double dpoVal = NormalizeDouble(dpoInd[1], 6);
      double dpoPreVal = NormalizeDouble(dpoInd[2], 6);
      double ask = SymbolInfoDouble(_Symbol,SYMBOL_ASK);
      double bid = SymbolInfoDouble(_Symbol,SYMBOL_BID);
      if(dpoPreVal<0 && dpoVal>0)
        {
         double slVal=ask - slLvl*_Point;
         double tpVal=ask + tpLvl*_Point;
         trade.Buy(lotSize,_Symbol,ask,slVal,tpVal);
        }
      if(dpoPreVal>0 && dpoVal<0)
        {
         double slVal=bid + slLvl*_Point;
         double tpVal=bid - tpLvl*_Point;
         trade.Sell(lotSize,_Symbol,bid,slVal,tpVal);
        }
     }
  }
//+------------------------------------------------------------------+
As you can see in the above block of code, there are differences from the base code of DPO Values. These are the same as below.
Include the trade.mqh file to place orders
#include <trade/trade.mqh> Add more inputs with default values for lot size, stop loss level, and take profit level to be specified by the user.
input int         period=20; // Periods
input double      lotSize=1;
input double      slLvl=300;
input double      tpLvl=900;
Declare trade object to be used and barsTotal integer variable.
CTrade trade;
int barsTotal;
In the OnInit (), we define the barsTotal to be equal to the function of iBars to return the number of bars of the symbol and period from the history.
barsTotal=iBars(_Symbol,PERIOD_CURRENT);
In the OnTick(), we will declare bars as an integer variable and define it by the iBars function.
int bars=iBars(_Symbol,PERIOD_CURRENT);
We will set a condition for checking if there is a new bar to limit order placing by setting if the barsTotoal variable is not equal to bars, which means that there is a new bar plotted, then we will continue the code execution.
if(barsTotal != bars) In a new bar, update the barsTotal value by the bars value.
barsTotal=bars;
Update the last closed one with index 1 and declare an additional double variable for the previous DPO value with the index 2.
double dpoVal = NormalizeDouble(dpoInd[1], 6);
double dpoPreVal = NormalizeDouble(dpoInd[2], 6);
Declare and define ask and bid prices.
double ask = SymbolInfoDouble(_Symbol,SYMBOL_ASK);
double bid = SymbolInfoDouble(_Symbol,SYMBOL_BID);
Condition of the strategy, declare and define stop loss, take profit, and place orders.
if(dpoPreVal<0 && dpoVal>0)
  {
   double slVal=ask - slLvl*_Point;
   double tpVal=ask + tpLvl*_Point;
   trade.Buy(lotSize,_Symbol,ask,slVal,tpVal);
  }
if(dpoPreVal>0 && dpoVal<0)
   {
    double slVal=bid + slLvl*_Point;
    double tpVal=bid - tpLvl*_Point;
    trade.Sell(lotSize,_Symbol,bid,slVal,tpVal);
   }
After compiling the code without errors and attaching the EA to the chart, we can find that the positions can be placed in the same way as the following examples.
Buy position:
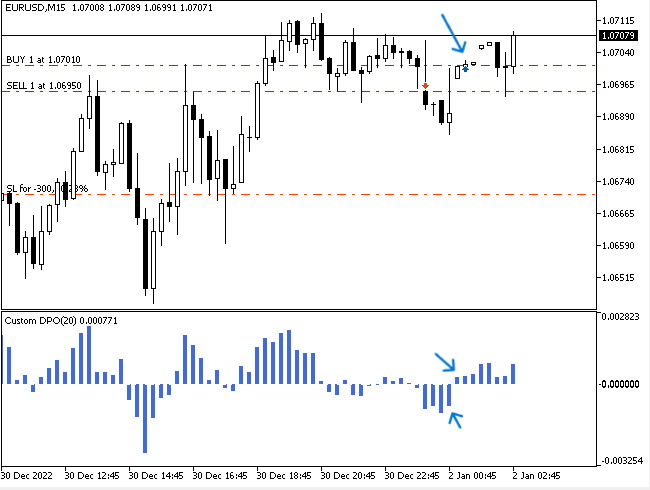
Sell position:
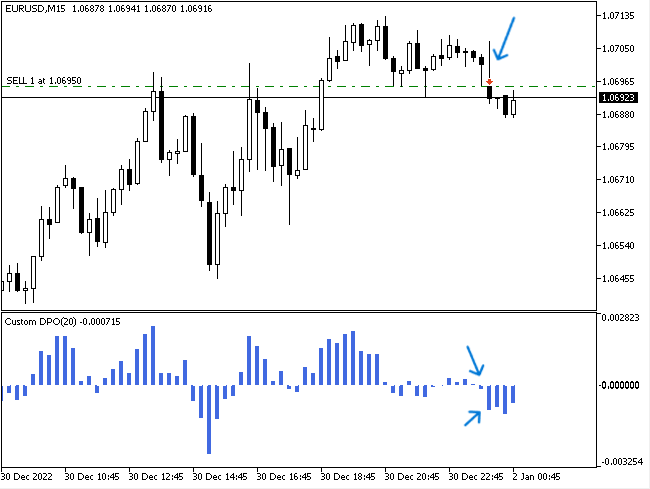
We now need to test all the strategies on the EUR/USD pair on time frames 5 minutes and 15 minutes over the period from 1 January to 31 December 2023. We will use a stop loss of 300 points and a take profit of 900 points. Based on the results, our main approach to optimization will be to test additional concepts or tools, such as integrating a moving average. It is also worth testing different timeframes to see which delivers the best performance.
Regarding the strategy testing results to compare each testing, we will focus on the following important key metrics:
- Net profit: It is calculated by subtracting the gross loss from the gross profit, and the highest value is the best.
- Balance DD relative: It is the maximum loss that the account experiences during trades, and the lowest is the best.
- Profit factor: It is the ratio of gross profit to gross loss, and the highest is the best.
- Expected Payoff: It is the average profit or loss of a trade, and the highest value is the best.
- Recovery factor: It measures how well the tested strategy recovers after losses, and he highest is the best.
- Sharpe Ratio: It determines the risk and stability of the tested trading system by comparing the return with the risk-free return, and the highest Sharpe Ratio is the best.
The testing results of the 15-minute time frame will be the same as below:
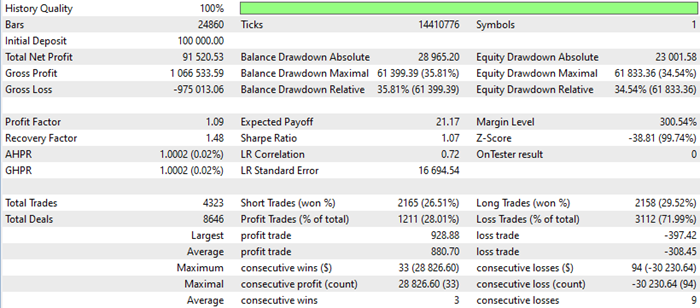
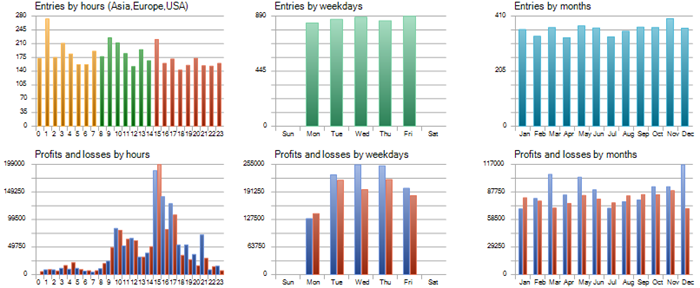
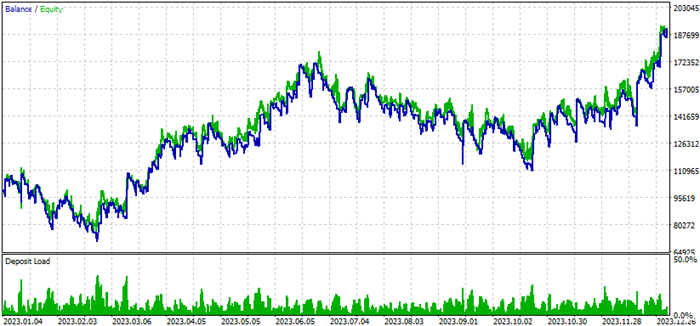
Based on the above results of the test of a 15-minute time frame, we can find the following important values for the test numbers:
- Net Profit: 91520.53 USD.
- Balance DD relative: 35.81%.
- Profit factor: 1.09.
- Expected payoff: 21.17.
- Recovery factor: 1.48.
- Sharpe Ratio: 1.07.
The testing results of the 5-minute time frame will be the same as below:
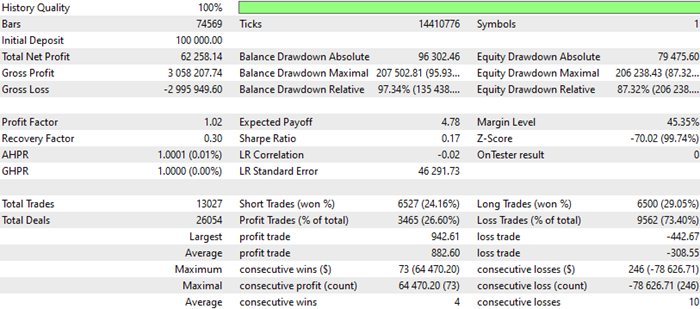
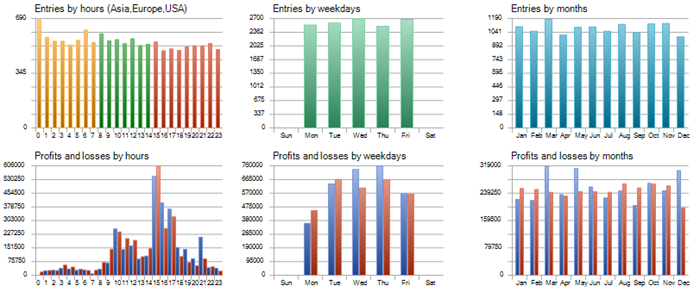
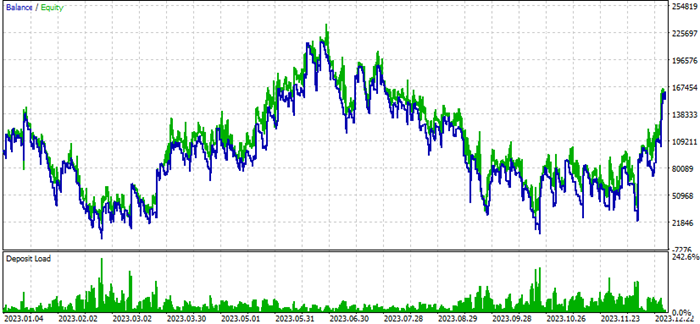
Based on the above results of the test of a 5-minute time frame, the following are important values for this testing:
- Net Profit: 62258.14.
- Balance DD relative: 97.34%.
- Profit factor: 1.02.
- Expected payoff: 4.78.
- Recovery factor: 0.30.
- Sharpe Ratio: 0.17.
As we can see, this strategy's testing results on the 15-minute chart are better than on the 5-minute chart. However, there is still a high drawdown, so we will consider adding another technical tool — the moving average — as an optimisation to see if it improves the results.
The DPO Trend Validation strategy:
As mentioned, this strategy involves coding an EA that can automatically place orders based on the position of the DPO value and the relationship between the moving average and prices. This provides an additional layer of confirmation in the form of the moving average. The program needs to check every tick for the current and previous DPO values, the moving average, the closing price and the bid prices.
Placing a buy order when:
- The previous close is less than the previous value of the moving average.
- The ask price is greater than the current moving average value
- The current DPO value is greater than zero.
Placing a sell order when:
- The previous close is greater than the previous value of the moving average.
- The bid price is less than the current moving average value
- The current DPO value is less than zero.
Below is the full code of this type of program that can be run on the MT5:
//+------------------------------------------------------------------+
//|                                          DPO_trendValidation.mq5 |
//|                                  Copyright 2024, MetaQuotes Ltd. |
//|                                             https://www.mql5.com |
//+------------------------------------------------------------------+
#include <trade/trade.mqh>
input int         period=20; // Periods
input int         maPeriodInp=20; //MA Period
input double      lotSize=1;
input double      slLvl=300;
input double      tpLvl=900;
int dpo;
int ma;
CTrade trade;
int barsTotal;
int OnInit()
  {
   barsTotal=iBars(_Symbol,PERIOD_CURRENT);
   dpo = iCustom(_Symbol,PERIOD_CURRENT,"customDPO",period);
   ma = iMA(_Symbol,PERIOD_CURRENT,maPeriodInp,0,MODE_SMA,PRICE_CLOSE);
   return(INIT_SUCCEEDED);
  }
void OnDeinit(const int reason)
  {
   Print("EA is removed");
  }
void OnTick()
  {
   int bars=iBars(_Symbol,PERIOD_CURRENT);
   if(barsTotal != bars)
     {
      barsTotal=bars;
      double dpoInd[];
      double maInd[];
      CopyBuffer(dpo,0,0,3,dpoInd);
      CopyBuffer(ma,0,0,3,maInd);
      ArraySetAsSeries(dpoInd,true);
      ArraySetAsSeries(maInd,true);
      double dpoVal = NormalizeDouble(dpoInd[0], 6);
      double maVal= NormalizeDouble(maInd[0],5);
      double dpoPreVal = NormalizeDouble(dpoInd[1], 5);
      double maPreVal = NormalizeDouble(maInd[1],5);;
      double ask = SymbolInfoDouble(_Symbol,SYMBOL_ASK);
      double bid = SymbolInfoDouble(_Symbol,SYMBOL_BID);
      double prevClose = iClose(_Symbol,PERIOD_CURRENT,1);
      if(prevClose<maPreVal && ask>maVal)
        {
         if(dpoVal>0)
           {
            double slVal=ask - slLvl*_Point;
            double tpVal=ask + tpLvl*_Point;
            trade.Buy(lotSize,_Symbol,ask,slVal,tpVal);
           }
        }
      if(prevClose>maPreVal && bid<maVal)
        {
         if(dpoVal<0)
           {
            double slVal=bid + slLvl*_Point;
            double tpVal=bid - tpLvl*_Point;
            trade.Sell(lotSize,_Symbol,bid,slVal,tpVal);
           }
        }
     }
  }
//+------------------------------------------------------------------+
Differences in the above code are the same as the following.
Add another input for the moving average period to be specified by the user:
input int maPeriodInp=20; //MA Period
Declare an integer variable for ma.
int ma; Defining the ma variable by using the iMA function to return the handle of the moving average indicator.
ma = iMA(_Symbol,PERIOD_CURRENT,maPeriodInp,0,MODE_SMA,PRICE_CLOSE);
Declare an array for the maInd[] as a double data type.
double maInd[]; Retrieve data from the specified MA indicator buffer using the CopyBuffer function.
CopyBuffer(ma,0,0,3,maInd);
Set the AS_SERIES flag for the maInd[ ] array to index its elements as a time series.
ArraySetAsSeries(maInd,true);
Declare and define the maVal and normalize it.
double maVal= NormalizeDouble(maInd[0],5);
Declare and define the previous close value by using the iClose function.
double prevClose = iClose(_Symbol,PERIOD_CURRENT,1);
Conditions of the strategy in case of buying and selling.
 if(prevClose<maPreVal && ask>maVal)
   {
    if(dpoVal>0)
      {
       double slVal=ask - slLvl*_Point;
       double tpVal=ask + tpLvl*_Point;
       trade.Buy(lotSize,_Symbol,ask,slVal,tpVal);
      }
   }
if(prevClose>maPreVal && bid<maVal)
   {
    if(dpoVal<0)
      {
       double slVal=bid + slLvl*_Point;
       double tpVal=bid - tpLvl*_Point;
       trade.Sell(lotSize,_Symbol,bid,slVal,tpVal);
       }
   }
After compiling the code of this strategy without any errors and attaching its file to the chart, we can find buy and sell positions can be placed the same as the following examples.
Buy position:
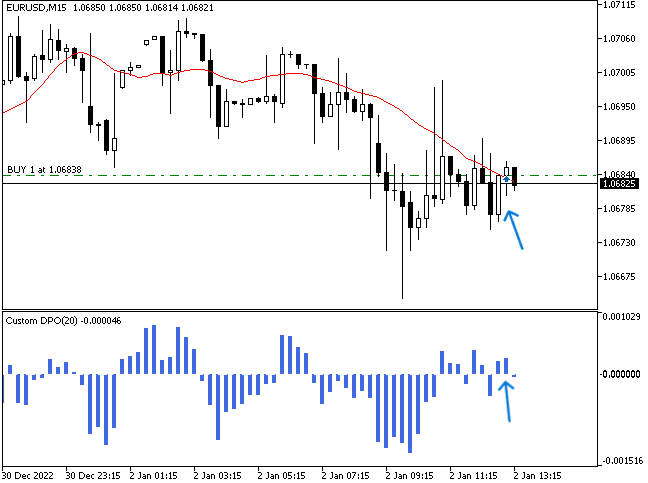
Sell position:
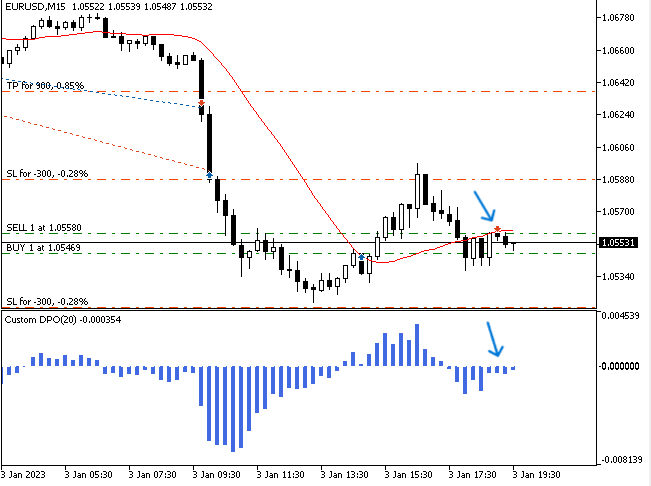
We need to test this strategy on the EURUSD pair over the same period of the whole year of 2023 as mentioned above on the time frames of 15-minutes and 5-minutes. The testing results of DPO trend validation strategy on the 15-minutes time frame will be the same as below:
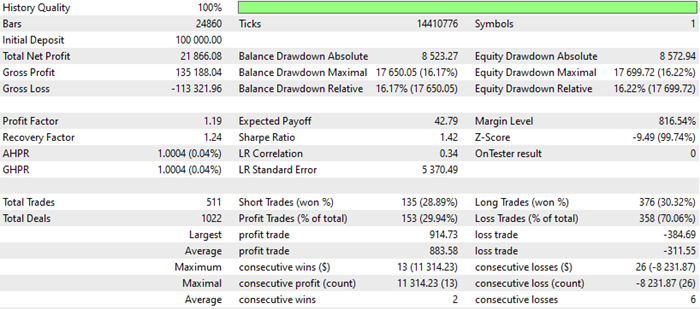
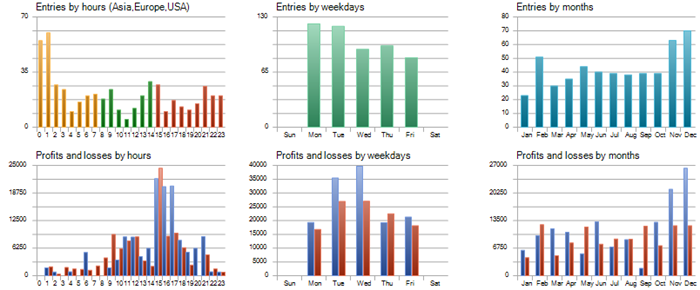
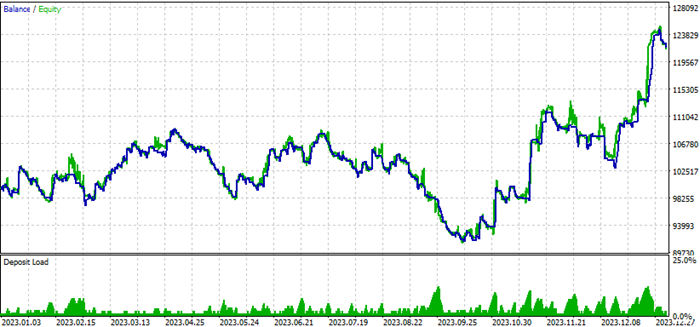
According to the above results of the test of a 15-minute time frame, the following are important values for this testing:
- Net Profit: 21866.08.
- Balance DD relative: 16.22%.
- Profit factor: 1.19.
- Expected payoff: 42.79.
- Recovery factor: 1.24.
- Sharpe Ratio: 1.42.
Testing results of the 5-minute time frame will be the same as below:
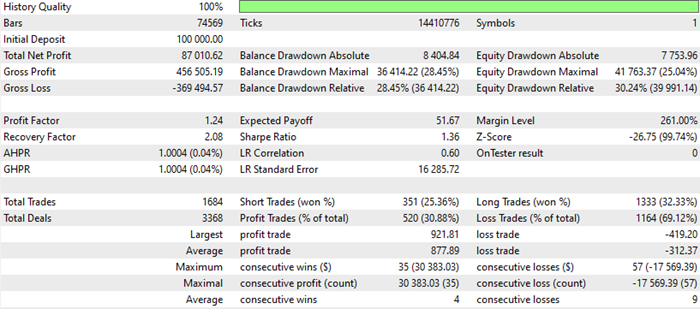
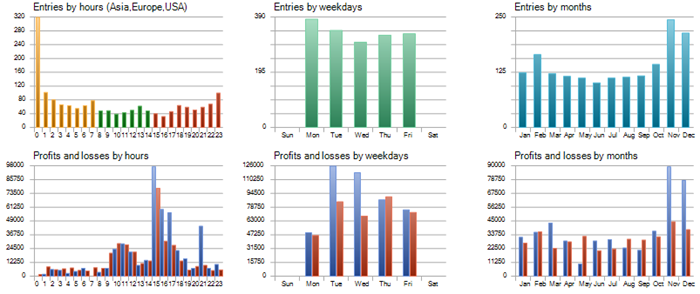
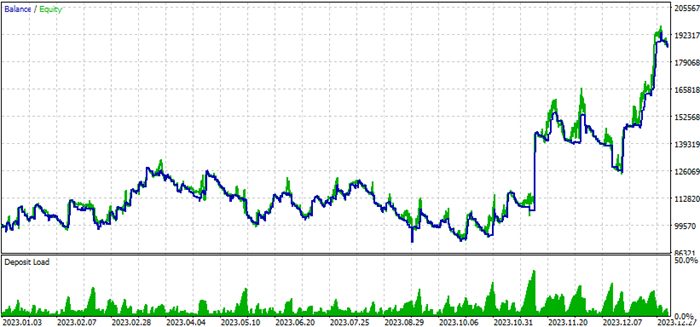
Depending on the above important figures, the results of the test of a 15-minute time frame are the same as below:
- Net Profit: 87010.62.
- Balance DD relative: 30.24%.
- Profit factor: 1.24.
- Expected payoff: 51.67.
- Recovery factor: 2.08.
- Sharpe Ratio: 1.36.
Now, we can see the best as per all result:
- The highest net profit: 91520.53. the 15-min of the DPO zero crossover strategy.
- The lowest balance DD relative: 16.22% for the 15-min of the DPO trend validation strategy.
- The highest profit factor: 1.24 for the 5-min of the DPO trend validation strategy.
- The highest expected payoff: 51.67 for the 5-min of the DPO trend validation strategy.
- The highest recovery factor: 2.08 for the 5-min of the DPO trend validation strategy.
- The highest Sharpe ratio: 1.42 for the 15-min of the DPO trend validation strategy.
It is clear that the optimized EA based on the moving average conformation gives overall better results for most measurements. So, I advise you to perform more tests using different concepts like another technical tools, different time frames, and different periods to make sure that you can get better results depending on your testing.
Conclusion
At the end of this article, it is supposed that you understand what is the Detrended price Oscillator (DPO) technical indicator through understanding what it measures, how it can be calculated, and how traders can use it. In addition to that, you understand how to code your custom one based on your preferences, and the most interesting thing is how to create a trading system based on two simple strategies:
- The DPO Zero Crossover Strategy
- The DPO Trend Validation Strategy
It is supposed that you understood how to optimize them by following different concepts as examples to get better results in your trading. Based on the methods that we used to optimize the mentioned trading systems, we realized which is the best one in terms of the most measurements of testing. I hope you found this article useful, and if you want to read more articles from me — such as guides on building trading systems based on popular technical indicators — you can access them through my publication page.
You can find my attached source code files below:
| File Name | Description |
|---|---|
| customDPO | It is for the custom DPO indicator |
| DPO_Val | It is for the EA of dynamic DPO values |
| DPO_Zero_Crossover | It is for the EA of DPO Zero Crossover strategy |
| DPO_trendValidation | It is for the EA of DPO Trend Validation strategy |
Warning: All rights to these materials are reserved by MetaQuotes Ltd. Copying or reprinting of these materials in whole or in part is prohibited.
This article was written by a user of the site and reflects their personal views. MetaQuotes Ltd is not responsible for the accuracy of the information presented, nor for any consequences resulting from the use of the solutions, strategies or recommendations described.
 MQL5 Wizard Techniques you should know (Part 80): Using Patterns of Ichimoku and the ADX-Wilder with TD3 Reinforcement Learning
 Automating Trading Strategies in MQL5 (Part 33): Creating a Price Action Shark Harmonic Pattern System
 Statistical Arbitrage Through Cointegrated Stocks (Part 5): Screening
 The MQL5 Standard Library Explorer (Part 1): Introduction with CTrade, CiMA, and CiATR
- Free trading apps
- Over 8,000 signals for copying
- Economic news for exploring financial markets
You agree to website policy and terms of use
Thank you Sir.
Basically I love your indicator.
I find it effective when used on higher timeframe eg: weekly