
Raw Code Optimization and Tweaking for Improving Back-Test Results

Introduction
The pursuit of reliable back-test results in algorithmic trading hinges not only on robust strategy logic but also on the efficiency and precision of the underlying code. Raw code optimization and tweaking are critical to ensuring that Expert Advisors (EAs) perform as intended, minimizing computational overhead while maximizing execution accuracy. Poorly optimized code can distort back-test outcomes through delayed order execution, incorrect signal detection, or resource exhaustion—issues that mask a strategy’s true potential.
During the strategy development process, we will take several key steps to ensure the EA is both functionally strong and technically sound. We’ll start by adding custom helper functions and reusable logic blocks to streamline operations and avoid repetitive code. Then, we'll introduce well-structured variables and constants that improve code readability and simplify parameter adjustments. These foundational tweaks will help in maintaining the code and improve overall execution time during heavy back-test loads or multi-symbol testing.
Another major area of enhancement involves leveraging technical indicators more efficiently. Instead of blindly calculating indicators on every tick or bar, we’ll implement smarter update logic to reduce load and lag. We’ll also experiment with different indicator combinations to support better decision-making in the EA’s logic. By combining structural code refinement, performance-aware functions, and indicator optimization, we can drastically improve both the quality and speed of back-testing—bringing us closer to a consistently profitable and deployable strategy.
Strategy Development
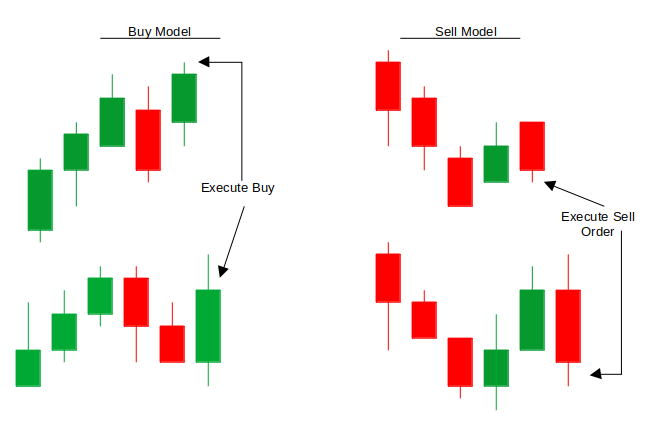
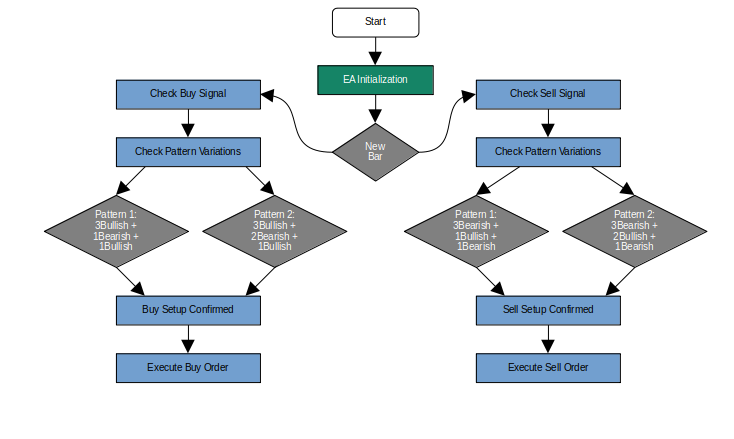
The development of our algorithmic trading strategy begins with a structured, methodical approach to pattern recognition and signal validation. At its core, the strategy employs a candlestick-based framework designed to identify high-probability reversal scenarios. For long positions, the logic systematically detects three consecutive bullish candles, followed by one or two corrective bearish candles, culminating in a confirming bullish candle at index 1 (the most recently closed bar).
Conversely, short positions are triggered by an inverse pattern: three consecutive bearish candles, succeeded by one or two retracement bullish candles, and finalized by a confirming bearish candle at index 1. This configuration ensures signals are validated only upon the formation of a new bar, aligning execution with confirmed price action rather than intra-bar fluctuations.
To operationalize this logic, the strategy’s architecture will prioritize modular code design and computational efficiency. First, helper functions will be implemented to abstract repetitive tasks, such as candlestick classification (bullish/bearish determination) and sequence validation (consecutive candle pattern checks). These functions will leverage MQL5’s native price data access methods, including `iOpen()` and `iClose()`, while minimizing redundant calculations through static variable caching.
Second, an event-driven execution model will ensure the Expert Advisor (EA) processes signals only upon new bar formation, as determined by timestamp comparisons at index 1. This approach reduces unnecessary computational load and prevents false triggers during bar development.
The final phase of development will focus on performance optimization and robustness testing. Technical indicators, such as volume filters or volatility-adjusted stop-loss levels, will be integrated to refine entry/exit precision. Additionally, historical buffer arrays will be preallocated to store candlestick patterns, reducing runtime memory allocation overhead. By combining these elements—modular code design, event-driven execution, and strategic indicator integration—the EA will achieve a balance between responsiveness and resource efficiency.
Code://+------------------------------------------------------------------+ //| Includes | //+------------------------------------------------------------------+ #include <Trade/Trade.mqh> MqlTick CTick, PTick; CTrade trade; enum InLot{ Lot_fixed, Lot_dynamic, }; //+------------------------------------------------------------------+ //| Inputs | //+------------------------------------------------------------------+ input group "--------------General Inputs--------------" input int RSI_Period = 14; input int TakeProfit = 100; // TP in points input ulong MagicNumber = 888888; // EA identifier input int MaxBarsCheck = 8; // Historical bars to analyze input InLot Lot_mode = Lot_fixed; input double In_Lot = 0.01; input bool TrailYourStop = true; input int trailingStop = 50; //input int StopLoss = 234; //+------------------------------------------------------------------+ //| Global Variables | //+------------------------------------------------------------------+ int rsiHandle, macdHanlde; datetime lastBarTime; double pointMultiplier; double StopLoss = 150; bool bullish_pattern_met = false; bool bearish_pattern_met = false; double first_bullish_low = 0.0; double first_bearish_high = 0.0; ENUM_TIMEFRAMES TimeFrame = PERIOD_CURRENT;
The Expert Advisor’s architecture integrates essential libraries and data structures to enable seamless trading functionality. The inclusion of the <Trade/Trade.mqh> library provides access to the CTrade class, streamlining order management operations such as position opening, modification, and closure. Two MqlTick structures—`CTick` and `PTick`—are employed to track real-time price data, ensuring precision in execution timing and market condition analysis. An enumeration (InLot) defines the EA’s position-sizing methodology, offering both fixed (Lot_fixed) and dynamic (Lot_dynamic) modes, with the latter reserved for potential risk-adjusted lot calculations in future iterations.
User customization is facilitated through a dedicated input interface, enabling parameter adjustments without altering core code. Critical settings include the RSI_Period (default: 14), which governs indicator sensitivity of which we will use later during development, and `TakeProfit ` and `trailingStop` values (in points) to define risk-reward thresholds. The `MagicNumber` parameter ensures trade identification integrity, while `MaxBarsCheck` determines the historical data depth for pattern analysis. Position-sizing flexibility is achieved via Lot_mode and In_Lot, and trailing stop features (TrailYourStop, trailingStop) automate profit protection as trades progress favorably.
Internally, global variables manage complex operational workflows. Indicator handles (rsiHandle, macdHandle) store and reference indicator instances during runtime, while `lastBarTime` facilitates temporal synchronization by recording the timestamp of the most recently analyzed candle. Boolean flags (bullish_pattern_met, bearish_pattern_met) and swing-level markers (first_bullish_low, first_bearish_high) dynamically monitor market conditions, and TimeFrame specifies the EA’s operational periodicity, defaulting to the active chart’s timeframe for immediate usability.
//+------------------------------------------------------------------+
//| Expert initialization function                                   |
//+------------------------------------------------------------------+
int OnInit(){

   // Create RSI and MACD indicator handles
   rsiHandle = iRSI(_Symbol, TimeFrame, RSI_Period, PRICE_CLOSE);
   macdHanlde = iMACD(_Symbol, TimeFrame, 12, 26, 9, PRICE_CLOSE);

   return(INIT_SUCCEEDED);
}
The `Oninit()` function properly initializes RSI and MACD indicators by assigning the correct settings for their periods and price types. These indicators are prepared in memory for future use in optimizing trade signals. A successful setup returns INIT_SUCCEEDED to confirm the EA is ready to run.
void OnTick(){

   if(!NewBarTrigger()) return;
   ThreeBar();
}
//+------------------------------------------------------------------+

//+------------------------------------------------------------------+
//| Detects new bar formation                                        |
//+------------------------------------------------------------------+
bool NewBarTrigger(){

   datetime currentTime = iTime(_Symbol, PERIOD_CURRENT, 0);
   if(currentTime != lastBarTime){
      lastBarTime = currentTime;
      return true;
   }
   return false;
}

double getHigh(int index) {
    return iHigh(_Symbol, _Period, index);
}

double getLow(int index) {
    return iLow(_Symbol, _Period, index);
}

//+------------------------------------------------------------------+
//| Execute trade with risk parameters                               |
//+------------------------------------------------------------------+
void ExecuteTrade(ENUM_ORDER_TYPE tradeType)
{
   double point = SymbolInfoDouble(_Symbol, SYMBOL_POINT);
   double price = (tradeType == ORDER_TYPE_BUY) ? SymbolInfoDouble(_Symbol, SYMBOL_ASK) :                                                  SymbolInfoDouble(_Symbol, SYMBOL_BID);

   // Convert StopLoss and TakeProfit from pips to actual price distances
   double sl_distance = StopLoss * point;
   double tp_distance = TakeProfit * point;

   double sl = (tradeType == ORDER_TYPE_BUY) ? price - sl_distance :
                                               price + sl_distance;
   double tp = (tradeType == ORDER_TYPE_BUY) ? price + tp_distance :
                                               price - tp_distance;
   trade.PositionOpen(_Symbol, tradeType, In_Lot, price, sl, tp, NULL);
}
The `OnTick()` function serves as our EA’s heartbeat, running on every incoming market tick. To avoid over-processing and unnecessary calculations, it first checks for a new candle using `NewBarTrigger()`. If a new bar has formed, we then proceed to call the `ThreeBar()` function, which contains our trading logic and pattern detection routine.
The `NewBarTrigger()` function is responsible for detecting the start of a new candle. It does so by comparing the current candle’s opening time to the previously stored one (`lastBarTime`). If a new timestamp is detected, it updates `lastBarTime`and returns true, allowing `OnTick()` to proceed. This ensures that trading decisions are made only once per bar, which is crucial for our strategy that relies on bar-close confirmations. The `getHigh()` and `getLow()` helper functions are simple utility calls that return the high and low price of a specific bar index on the current chart.
The `ExecuteTrade()` function handles placing trades with the proper risk parameters. It first fetches the current market price depending on the trade type (buy or sell), then calculates the Stop Loss and Take Profit in actual price units by converting the user-defined pip/point values using the symbol’s `Point` value. These calculated levels are then passed to the `PositionOpen()` method from the `CTrade` class, ensuring that each trade is executed with accurate and consistent risk controls.
//+------------------------------------------------------------------+
//| Candle pattern detection Function                                |
//+------------------------------------------------------------------+
void ThreeBar() {
   // Settings
   string symbol = Symbol();              // Current symbol
   ENUM_TIMEFRAMES timeframe = PERIOD_M5; // Timeframe (e.g., 1-hour)

   // Pattern detection variables
   int min_bullish_count = 3;
   int min_bearish_count = 3;
   int check_candles = 6;  // Check the last 6 candles for patterns

   bool bullish_pattern = false;
   bool bearish_pattern = false;
   static bool bullish_pattern_detected = false;
   static bool bearish_pattern_detected = false;

   // Loop through recent candles to search for patterns
   for (int i = check_candles; i >= min_bullish_count; i--) {

      // Reset pattern flags for each loop iteration
      bullish_pattern = false;
      bearish_pattern = false;

      // 1. Check for Bullish Trend Pattern
      int bullish_count = 0;
      int bearish_count = 0;

      // Count initial bullish candles
      for (int j = i; j >= i - min_bullish_count + 1; j--) {
         if (iClose(symbol, timeframe, j) > iOpen(symbol, timeframe, j)){
            bullish_count++;
            first_bullish_low = getLow(5);
         }
         else
            break;
      }

      // Check for 1 or 2 bearish candles followed by a bullish candle
      if (bullish_count >= min_bullish_count) {
         for (int j = i - bullish_count; j >= i - bullish_count - 1; j--) {
            if (iClose(symbol, timeframe, j) < iOpen(symbol, timeframe, j))
               bearish_count++;
            else
               break;
         }
         if ((bearish_count == 1 || bearish_count == 2) &&
             iClose(symbol, timeframe, i - bullish_count - bearish_count) > iOpen(symbol, timeframe, i - bullish_count - bearish_count)) {
            bullish_pattern = true;
         }
      }

      // 2. Check for Bearish Trend Pattern
      int bearish_candles_count = 0;
      int bullish_candles_count = 0;

      // Count initial bearish candles
      for (int j = i; j >= i - min_bearish_count + 1; j--) {
         if (iClose(symbol, timeframe, j) < iOpen(symbol, timeframe, j)){
            bearish_candles_count++;
            first_bearish_high = getHigh(5);
         }
         else
            break;
      }

      // Check for 1 or 2 bullish candles followed by a bearish candle
      if (bearish_candles_count >= min_bearish_count) {
         for (int j = i - bearish_candles_count; j >= i - bearish_candles_count - 1; j--) {
            if (iClose(symbol, timeframe, j) > iOpen(symbol, timeframe, j))
               bullish_candles_count++;
            else
               break;
         }
         if ((bullish_candles_count == 1 || bullish_candles_count == 2) &&
             iClose(symbol, timeframe, i - bearish_candles_count - bullish_candles_count) < iOpen(symbol, timeframe, i - bearish_candles_count - bullish_candles_count)) {
            bearish_pattern = true;
         }
      }

      // Print result and call functions only once for each pattern
      if (bullish_pattern && !bullish_pattern_detected) {
         Print("Bullish pattern conditions are met");
         ExecuteTrade(ORDER_TYPE_BUY); // Call to buyer function
         bullish_pattern_detected = true;
      } else if (!bullish_pattern) {
         bullish_pattern_detected = false; // Reset when conditions no longer met
      }

      if (bearish_pattern && !bearish_pattern_detected) {
         Print("Bearish pattern conditions are met");
         ExecuteTrade(ORDER_TYPE_SELL); // Call to seller function
         bearish_pattern_detected = true;
      } else if (!bearish_pattern) {
         bearish_pattern_detected = false; // Reset when conditions no longer met
      }
   }
}
The `ThreeBar()` function is the core pattern detection logic of our Expert Advisor. It analyzes recent candlestick formations on the M5 time-frame or any time frame you load the expert advisor to detect potential bullish or bearish trend reversal setups. The logic begins by scanning the last six candles to identify patterns where a series of at least three consecutive bullish or bearish candles is followed by a short pullback (one or two opposite candles) and then a confirmation candle in the original trend direction. If such a structure is identified, it flags the presence of a valid pattern.
During each scan loop, key price points like the low of a bullish swing or the high of a bearish swing are captured for potential future use, such as structure breaks or trade filters.
Currently, the EA opens two positions when we have one bearish candle after the bullish candle and opens another trade after the candle closes but opens one position when we have two bearish candles followed by a bullish candle. The same thing is happening for the sell signals. To resolve this issue, we need to add `break`, which immediately stops the loop once a pattern has triggered a trade. This prevents the EA from looping further into earlier candles and finding the same pattern in a different position, especially when the structure allows both 1 and 2-bar pullbacks.
// Print result and call functions only once for each pattern
if (bullish_pattern && !bullish_pattern_detected) {
   Print("Bullish pattern conditions are met");
   ExecuteTrade(ORDER_TYPE_BUY);
   bullish_pattern_detected = true;
   break; // prevent further detection in this run
} else if (!bullish_pattern) {
   bullish_pattern_detected = false;
}

if (bearish_pattern && !bearish_pattern_detected) {
   Print("Bearish pattern conditions are met");
   ExecuteTrade(ORDER_TYPE_SELL);
   bearish_pattern_detected = true;
   break; // prevent further detection in this run
} else if (!bearish_pattern) {
   bearish_pattern_detected = false;
}
Incorporating indicator filters:
// Indicator buffers
double rsi_value[1];    // Use array for buffer storage
double macd_main[1];
double macd_signal[1];

// Get indicator values - with error checking
if (CopyBuffer(rsiHandle, 0, 0, 1, rsi_value) <= 0) {
    Print("RSI CopyBuffer error: ", GetLastError());
    return;
}

if (CopyBuffer(macdHandle, 0, 0, 1, macd_main) <= 0) {
    Print("MACD Main Line error: ", GetLastError());
    return;
}

if (CopyBuffer(macdHandle, 1, 0, 1, macd_signal) <= 0) {
    Print("MACD Signal Line error: ", GetLastError());
    return;
}
Before incorporating indicator filters into the trade logic, we must retrieve and verify the RSI and MACD indicator values using `CopyBuffer()`. This ensures that the EA obtains the most recent readings from the indicator handles. In the code above, we use arrays to store a single value from each indicator buffer, and error handling is included after each buffer copy to catch any issues, such as failed handle access or missing data.
If any buffer fails to retrieve data, the function exits early and logs the corresponding error, preventing the EA from making trade decisions based on invalid or missing indicator inputs.
// Filter + Trade Logic
if (bullish_pattern && !bullish_pattern_detected &&
    rsi_value[0] > 50 && macd_main[0] > macd_signal[0])
{
    Print("Bullish pattern confirmed with RSI(", rsi_value[0], ") and MACD(",
          macd_main[0], "/", macd_signal[0], ")");
    ExecuteTrade(ORDER_TYPE_BUY);
    bullish_pattern_detected = true;
    break;
 }
else if (!bullish_pattern)
    bullish_pattern_detected = false;

if (bearish_pattern && !bearish_pattern_detected &&
    rsi_value[0] < 50 && macd_main[0] < macd_signal[0])
{
    Print("Bearish pattern confirmed with RSI(", rsi_value[0], ") and MACD(",
          macd_main[0], "/", macd_signal[0], ")");
    ExecuteTrade(ORDER_TYPE_SELL);
    bearish_pattern_detected = true;
    break;
}
else if (!bearish_pattern)
    bearish_pattern_detected = false;
The three-bar candlestick pattern alone often yields poor back-test results, as it does not account for the overall market trend, leading to frequent false signals. To improve performance, we introduce trend confirmation by incorporating RSI and MACD indicators directly into the trade decision block.
For a bullish signal to be valid, we now require RSI to be above 50—indicating bullish momentum—and the MACD main line to be above the signal line—suggesting upward trend confirmation. Similarly, for bearish signals, RSI must be below 50, and the MACD main line must be below the signal line. This filtering logic strengthens trade accuracy by aligning entries with broader market momentum.
By embedding these filters, we ensure that trades triggered by the three-bar pattern are only executed when supported by technical indicators that reflect the prevailing market direction. This dual confirmation approach reduces the frequency of trades during choppy or sideways markets and increases the probability of entering trades that have momentum behind them.
Ultimately, this refinement enhances the EA’s decision-making capability, leading to more consistent and favorable back-test results while helping avoid whipsaws caused by relying solely on candlestick structure.
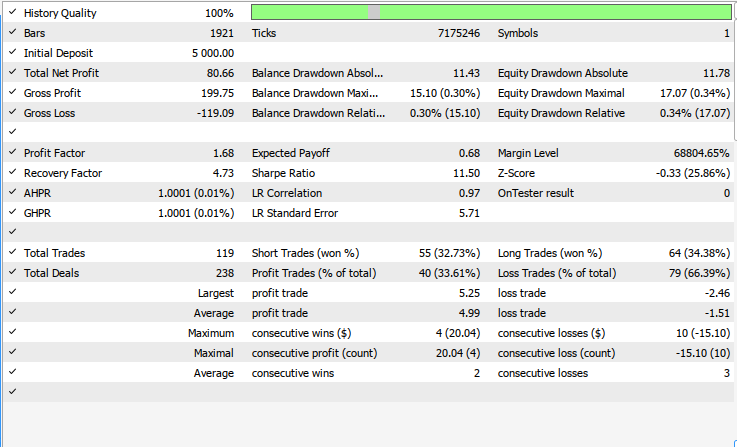
Back Test Results on (XAU/USD)
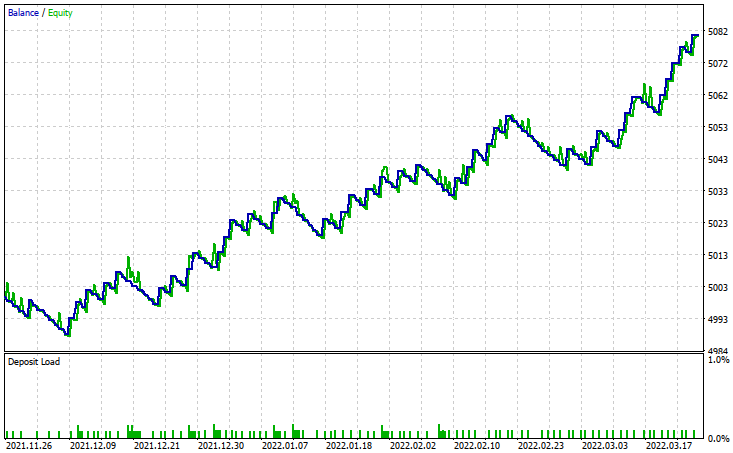
The back-testing was evaluated using historical price data for XAUUSD (Gold/US Dollar) on the 1-hour timeframe across a 4-month testing window (November 26, 2021 – March 17, 2022). Key parameters included:
- RSI Period: 14
- Risk Management: 500-points Take Profit (TP), 150-points Stop Loss (SL), fixed lot sizing
- Analysis Configuration: 8-bars historical look-back period
Market Context
During the testing period, gold traded at an average price of $1,841.59, with volatility extremes ranging from $1,752.95 (low) to $2,070.48 (high). This upward trajectory reflects a strong bullish bias, particularly evident in early 2022, when prices surged by approximately 18% to reach the March peak. The pronounced up trend during this period aligns with macroeconomic factors.
Conclusion
In this optimization process, we addressed the limitations of relying solely on a three-bar candlestick pattern for trade entries by incorporating key technical indicators—RSI and MACD. We began by ensuring robust data retrieval using indicator handles and buffer copying with error checks. We then applied these indicators as confirmation filters within the trade execution logic, aligning trades with the prevailing market trend. This significantly improves trade quality and back-test consistency by filtering out low-probability signals during ranging or counter-trend conditions.
In summary, combining raw price action patterns with momentum-based indicators such as RSI and MACD creates a more context-aware trading system. This layered approach enhances the Expert Advisor’s ability to differentiate between high-quality and low-quality trade setups. By requiring confluence between candlestick patterns and broader trend signals, the EA becomes more disciplined and less reactive to short-term noise, ultimately resulting in improved performance and robustness during both back-testing and live trading.
Further Improvement and Research:
| Area | Suggestion | Benefit |
|---|---|---|
| Dynamic Stop-Loss or Take-Profit | Adjust SL/TP based on ATR or recent volatility | Makes risk management adaptive to market conditions |
| Trend filter enhancement | Include moving averages (e.g., 200 EMA) to define long-term trend | Improves accuracy of entry direction |
| Trade frequency control | Add cool-down time between trades or maximum trades per day limit | Reduces over-trading and clustering of trades |
| Multi-Timeframe analysis | Confirm RSI and MACD trends on higher time-frames (e.g., H1, H4) | Enhances signal reliability by aligning across time-frames |
| News filtering | Integrate economic calendar or news time detection | Avoids trades during high-impact events |
Warning: All rights to these materials are reserved by MetaQuotes Ltd. Copying or reprinting of these materials in whole or in part is prohibited.
This article was written by a user of the site and reflects their personal views. MetaQuotes Ltd is not responsible for the accuracy of the information presented, nor for any consequences resulting from the use of the solutions, strategies or recommendations described.

 MQL5 Wizard Techniques you should know (Part 64): Using Patterns of DeMarker and Envelope Channels with the White-Noise Kernel
- Free trading apps
- Over 8,000 signals for copying
- Economic news for exploring financial markets
You agree to website policy and terms of use
Please enlighten me as to how CTick and PTick work. I see that both are declared along with Includes, but neither is referenced elsewhere in the code. In other words, what does CTick track; and what does PTick track?
(I can't find anything in the MQ documentation).
The pursuit of reliable back-test results in algorithmic trading hinges not only on robust strategy logic but also on the efficiency and precision of the underlying code. Raw code optimization and tweaking are critical to ensuring that Expert Advisors (EAs) perform as intended, minimizing computational overhead while maximizing execution accuracy. Poorly optimized code can distort back-test outcomes through delayed order execution, incorrect signal detection, or resource exhaustion—issues that mask a strategy’s true potential.
During the strategy development process, we will take several key steps to ensure the EA is both functionally strong and technically sound. We’ll start by adding custom helper functions and reusable logic blocks to streamline operations and avoid repetitive code. Then, we'll introduce well-structured variables and constants that improve code readability and simplify parameter adjustments. These foundational tweaks will help in maintaining the code and improve overall execution time during heavy back-test loads or multi-symbol testing.
Another major area of enhancement involves leveraging technical indicators more efficiently. Instead of blindly calculating indicators on every tick or bar, we’ll implement smarter update logic to reduce load and lag. We’ll also experiment with different indicator combinations to support better decision-making in the EA’s logic. By combining structural code refinement, performance-aware functions, and indicator optimization, we can drastically improve both the quality and speed of back-testing—bringing us closer to a consistently profitable and deployable strategy.
I don't want to offend anyone, though I have to say this article is a failure. Here above is the introduction, with a lot of strong affirmations and , all which the author failed to implement.
My initial intention was to show the problems with the code, but they are so much... so I will just point 2.
Robust code ? Where is the error checking done ? Inputs are used as is without any checking, stoplevels is not checked, margin is not checked, trading request is not checked...
Performance ? using iClose/iOpen candle by candle ? These functions are the slowest to deal with data.
Additionally the getLow(5) seems a bug. I didn't check further.
I will not comment on the trading algorithm itself, I just noted how the author conveniently selected a short period in history where the EA gives good results.
This article is very poor.
Good afternoon, this very good analysis, but complement the same with the strength, if volume!!! although candlesticks give you information what ends up confirming is the volume, this way you could execute more trade without error!!!
Greetings