
Multiple Symbol Analysis With Python And MQL5 (Part 3): Triangular Exchange Rates

Financial markets are inherently noisy. It is common for traders to suffer unnecessary drawdowns caused by false trading signals that encouraged the trader to open his positions prematurely. There are many different trading strategies and principles that have been developed in light of this issue. Most of these axioms essentially teach the trader to wait before acting, and instead seek alternative sources of confirmation or additional signs of strength.
These rules generally have no specified horizon in which the confirmation signals must be found, and may occasionally cost the trader some regret, as traders that follow such rules of thumb will tend to lose good entry levels on most of the trades they eventually decide to enter.
It is evident to the reader that there is a clear need for us to try and formulate trading strategies capable of measuring the strength in a market as close to real time as we can get. It may be possible for us to achieve this, if we try and take advantage of connected markets, and look for predictable patterns that make sense to us. We can keep on the lookout for cross-market patterns we believe are predictable, instead of potentially losing pips from each trade we are interested in, compounding our losses over time.
For readers who are possibly new to the school of thought around cross-market patterns, we will provide a brief introduction into the topic, so you may appreciate why some traders will tell you these cross-market patterns are typically predictable, and if you can get them right, they have the potential to be robust.
Around 90% of the world’s commodities are priced in American Dollars. But, some commodities are so commonly traded, they are often quoted in several currencies at once.
Precious metals, like Silver, are typically quoted in both American Dollars and Euros at the same time. We will focus on Silver as our example for today. One may find that his broker offers quotes of the price of silver in Dollars (XAGUSD) and in Euros (XAGEUR) simultaneously.
If we want to trade XAGUSD, and we know that it is fundamentally connected to XAGEUR, how can we leverage this understanding to our advantage, to accept or reject trading opportunities that are offered to us, without having to wait indefinitely for confirmation?
By factoring in the prevailing exchange rate between Euros & Dollars (EURUSD), one may be able to form a triangular trading strategy, that finds predictable patterns forming between the price of Silver in Dollars, Euros and the fair rate of exchange of Euros to Dollars (EURUSD). We aim to equip the reader with a trading strategy that is robust to noise and can help uncover "hidden" market sentiment from ordinary market quotes received in your MetaTrader 5 Terminal.
Overview of Our Trading Strategy
Before we dive into the details of our trading strategy, it is let us first ensure that every reader has a foundational understanding of the base and quote in a traded pair. If we take the EURUSD as our example, the EUR (Euro), is our base. The first abbreviation on the left of the pair is the base. As the exchange rate displayed on a chart rises away from 0, the value of the base currency is increasing. Therefore, if we are looking at a chart of the EURUSD exchange rate, and the chart rises, it signals we need to sell more American dollars, to earn 1 Euro in the FX spot market.

Fig 1: Understanding the difference between the base and the quote in a pair
On the other hand, the second symbol listed is the quote. The value of the quote increases, as the displayed exchange rate on the chart falls closer to 0. Meaning we will need to sell less and less American Dollars, to obtain 1 Euro.

Fig 2: Focusing on the quote
We can now consider our particular trading setup knowing that no reader will be left behind. We are considering 3 different markets, with the aim of only trading 1. Our target is the XAGUSD. If we want to gain and understanding of which direction the XAGUSD could be heading in, our strategy will begin by first checking the EURUSD exchange rate.
If the EURUSD exchange rate is rising, then the Euro (quote) is appreciating, and the Dollar (base) is depreciating. One could expect that a commodity priced in both Euros and Dollars may become cheaper in Euros since the Euro has gained purchasing power, and more expensive in Dollars, since the Dollar lost value in the FX Market.
This thought experiment hopefully gave readers who may be totally unfamiliar with such trading strategies an idea of how 3 markets could be expected to "mirror" each other under certain assumptions.
By analyzing the performance of these 3 markets at the same time, we can essentially create a strategy that may not always need to wait for confirmation. If our assumptions about the interconnected nature of these markets holds, then we should have a viable framework, that can be adopted to other markets the reader is interested in trading.
A visual mind-map of the trading strategy is illustrated in Fig 4. Generally speaking, if the EURUSD exchange rate is falling, we would expect goods priced in Euros to become more expensive, and goods priced in Dollars to become cheaper. Our strategy will check the EURUSD exchange, the price of Silver in Euros, and the price of Silver in Dollars, looking to find this particular pattern. If this cross market pattern is found, we will short the price of Silver in Dollars.
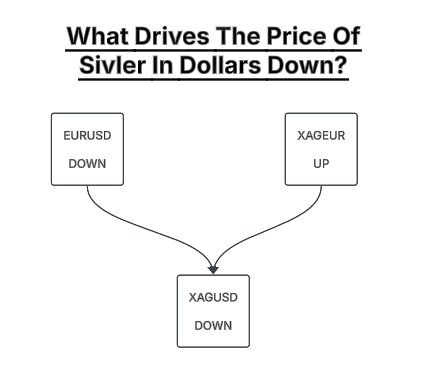
Fig 3: Visualizing our rules for going short the XAUUSD
We apply the same set of rules in the opposite sense, when we want to go long on the price of Silver in Dollars. We desire to observe strength in the FX market, backing the observed price action across both the European and American pricing of the commodity. Otherwise, moves that aren't backed by cross market patterns, may be fragile and easily reversed. If our assumptions about the behavior of the market is true, then our strategy should be sound. And may substitute the need to "wait for confirmation", if cross market analysis makes sense for your individual portfolio.
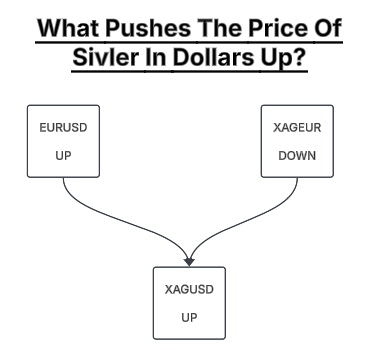
Fig 4: Visualizing our trading rules for going long on XAGUSD
The reader should be aware that, in truth, there are most likely numerous complicated factors that push the price of Silver up or down. We are only trying to summarize these complicated relationships, using simpler relationships.
Overview of The Back Test Period
We will test our strategy from the first of November 2023 until the first of January 2025. The remaining data we have, from the first of November 2022 until the end of October 2023 will be used to train our application. In future versions of the article, we will substitute our simple model of the interconnected nature of these markets, for models our computer can learn independently. Therefore, although we will not use the training partition in this discussion, we will make use of it, in future discussions.

Fig 5: Understanding our back test period for our discussion
Getting Started In MQL5
Our strategy requires that we follow three markets at once. Therefore, let us start off by creating system constants to keep track of each market we have open interest in. This allows us to easily swap between these markets and compare their performance.
//+------------------------------------------------------------------+
//|                                               Baseline Model.mq5 |
//|                                               Gamuchirai Ndawana |
//|                    https://www.mql5.com/en/users/gamuchiraindawa |
//+------------------------------------------------------------------+
#property copyright "Gamuchirai Ndawana"
#property link      "https://www.mql5.com/en/users/gamuchiraindawa"
#property version   "1.00"

//+------------------------------------------------------------------+
//| System Constants                                                 |
//+------------------------------------------------------------------+
#define SYMBOL_ONE   "XAGUSD"                                                       //--- Our primary   symbol, the price of Silver in USD
#define SYMBOL_TWO   "XAGEUR"                                                       //--- Our secondary symbol, the price of Silver in EUR
#define SYMBOL_THREE "EURUSD"                                                       //--- Our EURUSD exchange rate.
#define FETCH        24                                                             //--- How many bars of data should we fetch?
#define TF_1         PERIOD_H1                                                      //--- Our intended time frame
#define VOLUME       SymbolInfoDouble(SYMBOL_ONE,SYMBOL_VOLUME_MIN) * 10            //--- Our trading volume
We will use the MQL5 vector type, to fetch market data and rapidly transform it.
//+------------------------------------------------------------------+
//| Global variables                                                 |
//+------------------------------------------------------------------+
vector eurusd,xagusd,xageur;
double eurusd_growth,xagusd_growth,xageur_growth,bid,ask;
double sl_width = 3e2 * _Point;
The trade library allows us to open and manage our trades, we require it for our exercise today.
//+------------------------------------------------------------------+
//| Libraries                                                        |
//+------------------------------------------------------------------+
#include  <Trade\Trade.mqh>
CTrade Trade;
The MQL5 language is designed to help us trade effectively. Each event you can think of happening in the market, is mapped to specific events. Receiving new prices is an event. When the event is registered, the OnTikc() event handler, is called. The functions inside this event handler will be executed.
//+------------------------------------------------------------------+
//| Expert initialization function                                   |
//+------------------------------------------------------------------+
int OnInit()
  {
//--- Setup our technical indicators
   setup();
//---
   return(INIT_SUCCEEDED);
  }
//+------------------------------------------------------------------+
//| Expert deinitialization function                                 |
//+------------------------------------------------------------------+
void OnDeinit(const int reason)
  {
//---
  }
//+------------------------------------------------------------------+
//| Expert tick function                                             |
//+------------------------------------------------------------------+
void OnTick()
  {
//--- New prices have been quoted
   new_quotes_received();
  }
//+------------------------------------------------------------------+
Whenever we receive new quotes, we want to first check if a complete candle has formed. In the cases when a new candle has been formed, we will then update our system variables and attempt to find a trading opportunity.
//+------------------------------------------------------------------+
//| Custom functions                                                 |
//+------------------------------------------------------------------+

//+------------------------------------------------------------------+
//| Updates system variables accordingly                             |
//+------------------------------------------------------------------+
void new_quotes_received(void)
  {
   static datetime time_stamp;
   datetime time = iTime(SYMBOL_ONE,TF_1,0);

   if(time_stamp != time)
     {
      time_stamp = time;
      update();
     }
  }
When our system is loaded for the first time, we want to ensure that all the markets we need are activated, and readily available.
//+------------------------------------------------------------------+
//| Setup our technical indicators and select the symbols we need    |
//+------------------------------------------------------------------+
void setup(void)
  {
//--- Select the symbols we need
   SymbolSelect(SYMBOL_ONE,true);
   SymbolSelect(SYMBOL_TWO,true);
   SymbolSelect(SYMBOL_THREE,true);
  }
Once a new candle is formed, we will read in updated prices from each of the markets we are following. We can measure the growth in the market by dividing its present value, by its past value. If the division produces a quantity less than 1, the market's value is diminishing. Otherwise, the market is appreciating.
//+------------------------------------------------------------------+
//| Update our system setup                                          |
//+------------------------------------------------------------------+
void update(void)
  {
//--- Fetch updated prices
   xagusd.CopyRates(SYMBOL_ONE,TF_1,COPY_RATES_CLOSE,1,FETCH);
   xageur.CopyRates(SYMBOL_TWO,TF_1,COPY_RATES_CLOSE,1,FETCH);
   eurusd.CopyRates(SYMBOL_THREE,TF_1,COPY_RATES_CLOSE,1,FETCH);

//--- Calculate the growth in market prices
   eurusd_growth = eurusd[0] / eurusd[FETCH - 1];
   xageur_growth = xageur[0] / xageur[FETCH - 1];
   xagusd_growth = xagusd[0] / xagusd[FETCH - 1];

//--- Update system variables
   SymbolSelect(SYMBOL_ONE,true);

   bid = SymbolInfoDouble(SYMBOL_ONE,SYMBOL_BID);
   ask = SymbolInfoDouble(SYMBOL_ONE,SYMBOL_ASK);

//--- Check if we need to setup a new position
   if(PositionsTotal() == 0)
      find_setup();

//--- Check if we need to manage our positions
   if(PositionsTotal() > 0)
      manage_setup();

//--- Give feedback on the market growth
   Comment("EURUSD Growth: ",eurusd_growth,"\nXAGEUR Growth: ",xageur_growth,"\nXAGUSD Grwoth: ",xagusd_growth);
  }
Our trading setup can be imagined as a specific configuration we want to find the markets in, relative to each other. We want to essentially see the moves in the XAGUSD market, being backed by the moves in the EURUSD and XAGEUR markets, respectively. The rules we have specified below, are equivalent to the visual illustration we gave in Figures 4 and 5.
//+------------------------------------------------------------------+
//| Find setup                                                       |
//+------------------------------------------------------------------+
void find_setup(void)
  {
   //--- Check if the current market setup matches our expectations for selling
   if((eurusd_growth < 1) && (xageur_growth > 1) && (xagusd_growth < 1))
     {
      Trade.Sell(VOLUME,SYMBOL_ONE,bid,(ask + sl_width),(ask - sl_width),"");
     }

   //--- Check if the current market setup matches our expectations for buying
   if((eurusd_growth > 1) && (xageur_growth < 1) && (xagusd_growth > 1))
     {
      Trade.Buy(VOLUME,SYMBOL_ONE,ask,(bid - sl_width),(bid + sl_width),"");
     }
  }
Once opened, our trades will be then supervised by a trailing stop loss to help us retain our profits.
//+------------------------------------------------------------------+
//| Manage setup                                                     |
//+------------------------------------------------------------------+
void manage_setup(void)
  {
   //--- Select our open position
   if(PositionSelect(SYMBOL_ONE))
     {
      double current_sl = PositionGetDouble(POSITION_SL);
      double current_tp = PositionGetDouble(POSITION_TP);

      //--- Buy setup
      if(current_sl < current_tp)
        {
         if((bid - sl_width) > current_sl)
            Trade.PositionModify(SYMBOL_ONE,(bid - sl_width),(bid + sl_width));
        }

      //--- Sell setup
      if(current_sl > current_tp)
        {
         if((ask + sl_width) < current_sl)
            Trade.PositionModify(SYMBOL_ONE,(ask + sl_width),(ask - sl_width));
        }
     }
  }
Lastly, we shall undefine the system constants we defined earlier.
//+------------------------------------------------------------------+
//| Undefine system constants                                        |
//+------------------------------------------------------------------+
#undef TF_1
#undef SYMBOL_ONE
#undef SYMBOL_TWO
#undef SYMBOL_THREE
#undef VOLUME
#undef FETCH
When we put all the components of our system together, our application is now complete.
//+------------------------------------------------------------------+
//|                                               Baseline Model.mq5 |
//|                                               Gamuchirai Ndawana |
//|                    https://www.mql5.com/en/users/gamuchiraindawa |
//+------------------------------------------------------------------+
#property copyright "Gamuchirai Ndawana"
#property link      "https://www.mql5.com/en/users/gamuchiraindawa"
#property version   "1.00"

//+------------------------------------------------------------------+
//| System Constants                                                 |
//+------------------------------------------------------------------+
#define SYMBOL_ONE   "XAGUSD"                                                       //--- Our primary   symbol, the price of Silver in USD
#define SYMBOL_TWO   "XAGEUR"                                                       //--- Our secondary symbol, the price of Silver in EUR
#define SYMBOL_THREE "EURUSD"                                                       //--- Our EURUSD exchange rate.
#define FETCH        24                                                             //--- How many bars of data should we fetch?
#define TF_1         PERIOD_H1                                                      //--- Our intended time frame
#define VOLUME       SymbolInfoDouble(SYMBOL_ONE,SYMBOL_VOLUME_MIN) * 10            //--- Our trading volume

//+------------------------------------------------------------------+
//| Global variables                                                 |
//+------------------------------------------------------------------+
vector eurusd,xagusd,xageur;
double eurusd_growth,xagusd_growth,xageur_growth,bid,ask;
double sl_width = 3e2 * _Point;

//+------------------------------------------------------------------+
//| Libraries                                                        |
//+------------------------------------------------------------------+
#include  <Trade\Trade.mqh>
CTrade Trade;

//+------------------------------------------------------------------+
//| Expert initialization function                                   |
//+------------------------------------------------------------------+
int OnInit()
  {
//--- Setup our technical indicators
   setup();
//---
   return(INIT_SUCCEEDED);
  }
//+------------------------------------------------------------------+
//| Expert deinitialization function                                 |
//+------------------------------------------------------------------+
void OnDeinit(const int reason)
  {
//---
  }
//+------------------------------------------------------------------+
//| Expert tick function                                             |
//+------------------------------------------------------------------+
void OnTick()
  {
//--- New prices have been quoted
   new_quotes_received();
  }
//+------------------------------------------------------------------+

//+------------------------------------------------------------------+
//| Custom functions                                                 |
//+------------------------------------------------------------------+

//+------------------------------------------------------------------+
//| Updates system variables accordingly                             |
//+------------------------------------------------------------------+
void new_quotes_received(void)
  {
   static datetime time_stamp;
   datetime time = iTime(SYMBOL_ONE,TF_1,0);

   if(time_stamp != time)
     {
      time_stamp = time;
      update();
     }
  }

//+------------------------------------------------------------------+
//| Setup our technical indicators and select the symbols we need    |
//+------------------------------------------------------------------+
void setup(void)
  {
//--- Select the symbols we need
   SymbolSelect(SYMBOL_ONE,true);
   SymbolSelect(SYMBOL_TWO,true);
   SymbolSelect(SYMBOL_THREE,true);
  }

//+------------------------------------------------------------------+
//| Update our system setup                                          |
//+------------------------------------------------------------------+
void update(void)
  {
//--- Fetch updated prices
   xagusd.CopyRates(SYMBOL_ONE,TF_1,COPY_RATES_CLOSE,1,FETCH);
   xageur.CopyRates(SYMBOL_TWO,TF_1,COPY_RATES_CLOSE,1,FETCH);
   eurusd.CopyRates(SYMBOL_THREE,TF_1,COPY_RATES_CLOSE,1,FETCH);

//--- Calculate the growth in market prices
   eurusd_growth = eurusd[0] / eurusd[FETCH - 1];
   xageur_growth = xageur[0] / xageur[FETCH - 1];
   xagusd_growth = xagusd[0] / xagusd[FETCH - 1];

//--- Update system variables
   SymbolSelect(SYMBOL_ONE,true);

   bid = SymbolInfoDouble(SYMBOL_ONE,SYMBOL_BID);
   ask = SymbolInfoDouble(SYMBOL_ONE,SYMBOL_ASK);

//--- Check if we need to setup a new position
   if(PositionsTotal() == 0)
      find_setup();

//--- Check if we need to manage our positions
   if(PositionsTotal() > 0)
      manage_setup();

//--- Give feedback on the market growth
   Comment("EURUSD Growth: ",eurusd_growth,"\nXAGEUR Growth: ",xageur_growth,"\nXAGUSD Grwoth: ",xagusd_growth);
  }

//+------------------------------------------------------------------+
//| Find setup                                                       |
//+------------------------------------------------------------------+
void find_setup(void)
  {

   //--- Check if the current market setup matches our expectations for selling
   if((eurusd_growth < 1) && (xageur_growth > 1) && (xagusd_growth < 1))
     {
      Trade.Sell(VOLUME,SYMBOL_ONE,bid,(ask + sl_width),(ask - sl_width),"");
     }

   //--- Check if the current market setup matches our expectations for buying
   if((eurusd_growth > 1) && (xageur_growth < 1) && (xagusd_growth > 1))
     {
      Trade.Buy(VOLUME,SYMBOL_ONE,ask,(bid - sl_width),(bid + sl_width),"");
     }
  }

//+------------------------------------------------------------------+
//| Manage setup                                                     |
//+------------------------------------------------------------------+
void manage_setup(void)
  {
   //--- Select our open position
   if(PositionSelect(SYMBOL_ONE))
     {
      double current_sl = PositionGetDouble(POSITION_SL);
      double current_tp = PositionGetDouble(POSITION_TP);

      //--- Buy setup
      if(current_sl < current_tp)
        {
         if((bid - sl_width) > current_sl)
            Trade.PositionModify(SYMBOL_ONE,(bid - sl_width),(bid + sl_width));
        }

      //--- Sell setup
      if(current_sl > current_tp)
        {
         if((ask + sl_width) < current_sl)
            Trade.PositionModify(SYMBOL_ONE,(ask + sl_width),(ask - sl_width));
        }
     }
  }

//+------------------------------------------------------------------+
//| Undefine system constants                                        |
//+------------------------------------------------------------------+
#undef TF_1
#undef SYMBOL_ONE
#undef SYMBOL_TWO
#undef SYMBOL_THREE
#undef VOLUME
#undef FETCH
At the beginning of our discussion, we specified that our back test will be performed from the firs of November 2023 until January 2025. We will use the H1 time frame to perform our test. The H1 will hopefully provide us with numerous trading opportunities than higher time frames like the Daily, while not confusing us with as much noise when we trade even smaller time frames, such as the M1.
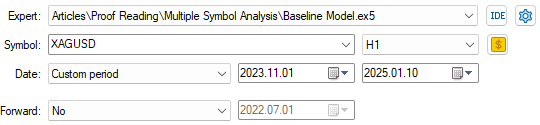
Fig 6: The dates we will use for our back test of our XAGUSD strategy
Our trading conditions will be selected to simulate the experience of real trading. We want to select random delay, with every tick based on real ticks. This provides a reliable simulation of market conditions experienced in the past.
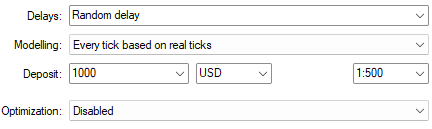
Fig 7: Our trading conditions, using real ticks, is the most realistic setting offered to us
Our strategy produced an equity curve characterized by bursts of profitability, followed by extended periods of loss. The strategy is profitable, but it is unstable in this form. Since our strategy keeps "oscillating" between profitable and unprofitable periods, it stands to reason that learning to identify this periodical behavior may help us make the strategy more stable.
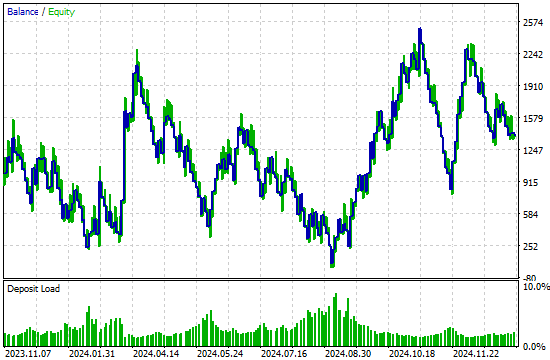
Fig 8: The equity curve produced by our trading strategy.
Performing a back test using our trading strategy reveals that our system could've potentially been a lot more profitable. Our goal to use three markets to successfully trade 1, is within reach. It is possible that our trading rules may need to be revised and possibly challenged by rules our computer can generate from the data. This may serve as the solution for our concerns over the stability of the algorithm.
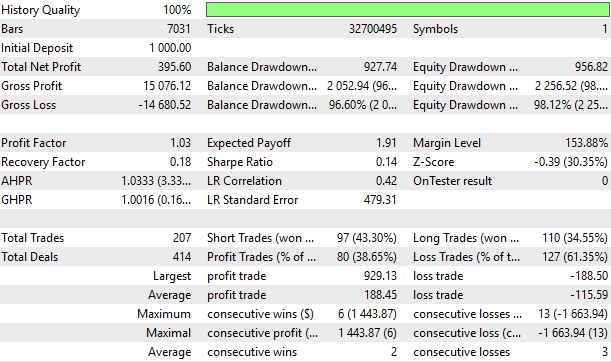
Fig 9: A detailed analysis of the performance of our trading strategy
Improving Our Initial Performance
There is plenty of room for improvement, as far as our initial strategy is concerned. We shall attempt to rectify the unstable behavior of our initial strategy, and straighten out the periodical oscillations we observed from profitable periods, to sustained unprofitable periods. We will briefly summarize the changes made to the system to obtain better results from our trading strategy:
| Proposed Improvement | Intended Purpose |
|---|---|
| Integrating Technical Indicators For Additional Confirmation | We can filter out considerable market noise by using additional confirmation from our technical indicators in our MetaTrader 5 terminal, to reduce the lag in our decision-making. |
| Building Individual Statistical Models of Each Market We Are Following | Having a model of the market can help us anticipate changes in market direction or volatility, and even help us subsequently scale back our position sizing in uncertain times. |
To get the ball rolling, we first need to fetch historical market quotes so that we have data to train our model. When employing statistical models, we aren't sure from the onset, which set of inputs are going to yield the best model. So it is generally good practice, to give yourself as many different features as you can think of, and then narrow down your choice later on.
//+------------------------------------------------------------------+
//|                                                      ProjectName |
//|                                      Copyright 2020, CompanyName |
//|                                       http://www.companyname.net |
//+------------------------------------------------------------------+
#property copyright "Copyright 2024, MetaQuotes Ltd."
#property link      "https://www.mql5.com"
#property version   "1.00"
#property script_show_inputs

//--- File name
string file_name = "XAGEUR XAGUSD EURUSD Triangular Exchange Rates.csv";

//--- Amount of data requested
input int size = 3000;

//+------------------------------------------------------------------+
//| Our script execution                                             |
//+------------------------------------------------------------------+
void OnStart()
  {
//---Write to file
   int file_handle=FileOpen(file_name,FILE_WRITE|FILE_ANSI|FILE_CSV,",");

   for(int i=size;i>=1;i--)
     {
      if(i == size)
        {
         FileWrite(file_handle,"Time","XAGUSD Open","XAGUSD High","XAGUSD Low","XAGUSD Close","XAGEUR Open","XAGEUR High","XAGEUR Low","XAGEUR Close","EURUSD Open","EURUSD High","EURUSD Low","EURUSD Close","Open Squared","High Squared","Low Squared","Close Squared","Open Cubed","High Cubed","Low Cubed","Close Cubed","Open Squre Root","High Square Root","Low Square Root","Close Square Root","Open Growth","High Growth","Low Grwoth","Close Growth","O / H","O / L","O / C","H / L","Log Open Growth","Log High Grwoth","Log Low Growth","Log Close Grwoth","Sin H / L","Cos O / C");
        }

      else
        {
         FileWrite(file_handle,
                   iTime("XAGUSD",PERIOD_CURRENT,i),
                   iOpen("XAGUSD",PERIOD_CURRENT,i),
                   iHigh("XAGUSD",PERIOD_CURRENT,i),
                   iLow("XAGUSD",PERIOD_CURRENT,i),
                   iClose("XAGUSD",PERIOD_CURRENT,i),
                   iOpen("XAGEUR",PERIOD_CURRENT,i),
                   iHigh("XAGEUR",PERIOD_CURRENT,i),
                   iLow("XAGEUR",PERIOD_CURRENT,i),
                   iClose("XAGEUR",PERIOD_CURRENT,i),
                   iOpen("EURUSD",PERIOD_CURRENT,i),
                   iHigh("EURUSD",PERIOD_CURRENT,i),
                   iLow("EURUSD",PERIOD_CURRENT,i),
                   iClose("EURUSD",PERIOD_CURRENT,i),
                   MathPow(iOpen("XAGUSD",PERIOD_CURRENT,i),2),
                   MathPow(iHigh("XAGUSD",PERIOD_CURRENT,i),2),
                   MathPow(iLow("XAGUSD",PERIOD_CURRENT,i),2),
                   MathPow(iClose("XAGUSD",PERIOD_CURRENT,i),2),
                   MathPow(iOpen("XAGUSD",PERIOD_CURRENT,i),3),
                   MathPow(iHigh("XAGUSD",PERIOD_CURRENT,i),3),
                   MathPow(iLow("XAGUSD",PERIOD_CURRENT,i),3),
                   MathPow(iClose("XAGUSD",PERIOD_CURRENT,i),3),
                   MathSqrt(iOpen("XAGUSD",PERIOD_CURRENT,i)),
                   MathSqrt(iHigh("XAGUSD",PERIOD_CURRENT,i)),
                   MathSqrt(iLow("XAGUSD",PERIOD_CURRENT,i)),
                   MathSqrt(iClose("XAGUSD",PERIOD_CURRENT,i)),
                   (iOpen("XAGUSD",PERIOD_CURRENT,i) / iOpen("XAGUSD",PERIOD_CURRENT,i+1)),
                   (iHigh("XAGUSD",PERIOD_CURRENT,i) / iHigh("XAGUSD",PERIOD_CURRENT,i+1)),
                   (iLow("XAGUSD",PERIOD_CURRENT,i) / iLow("XAGUSD",PERIOD_CURRENT,i+1)),
                   (iClose("XAGUSD",PERIOD_CURRENT,i) / iClose("XAGUSD",PERIOD_CURRENT,i+1)),
                   (iOpen("XAGUSD",PERIOD_CURRENT,i) / iHigh("XAGUSD",PERIOD_CURRENT,i+1)),
                   (iOpen("XAGUSD",PERIOD_CURRENT,i) / iLow("XAGUSD",PERIOD_CURRENT,i+1)),
                   (iOpen("XAGUSD",PERIOD_CURRENT,i) / iClose("XAGUSD",PERIOD_CURRENT,i+1)),
                   (iHigh("XAGUSD",PERIOD_CURRENT,i) / iLow("XAGUSD",PERIOD_CURRENT,i+1)),
                   MathLog10(iOpen("XAGUSD",PERIOD_CURRENT,i) / iOpen("XAGUSD",PERIOD_CURRENT,i+1)),
                   MathLog10(iHigh("XAGUSD",PERIOD_CURRENT,i) / iHigh("XAGUSD",PERIOD_CURRENT,i+1)),
                   MathLog10(iLow("XAGUSD",PERIOD_CURRENT,i) / iLow("XAGUSD",PERIOD_CURRENT,i+1)),
                   MathLog10(iClose("XAGUSD",PERIOD_CURRENT,i) / iClose("XAGUSD",PERIOD_CURRENT,i+1)),
                   (MathSin(iHigh("XAGUSD",PERIOD_CURRENT,i) / iLow("XAGUSD",PERIOD_CURRENT,i))),
                   (MathCos(iOpen("XAGUSD",PERIOD_CURRENT,i) / iClose("XAGUSD",PERIOD_CURRENT,i)))
                   );
        }
     }
//--- Close the file
   FileClose(file_handle);
  }
//+------------------------------------------------------------------+
Analyzing Our Data In Python
Once our training data is collected, we are ready to start building a statistical model of the data. First, we shall import the Python libraries we need.
#Import libraries we need
import pandas as pd
import numpy as np
import seaborn as sns
import matplotlib.pyplot as plt
Now, we shall label the data. Recall that we are trading the H1 time-frame, so let us set our label to be the change in price levels over 24 hours (1 trading day).
#Clean up the data
LOOK_AHEAD = 24
data = pd.read_csv("../XAGEUR XAGUSD EURUSD Triangular Exchange Rates.csv")
data["Target"] = data["XAGUSD Close"].shift(-LOOK_AHEAD) - data["XAGUSD Close"]
data.dropna(inplace=True)
data.reset_index(inplace=True,drop=True)
This is the most important step in the whole process we are following together. Our data will initially contain market quotes, that overlap with our back-test period. This is undesirable for practitioners seeking to get an honest estimation of the value of their trading strategy.
We shall therefore delete all market data that overlaps with the intended back-test period. Recall that in Fig 6, our back-test period clearly starts from the first of November 2023, and in Fig 10, our training data ends on the thirty-first of October 2023.
#Drop the dates corresponding to our backtest
_    = data.iloc[-((24 * 365) - 918):,:]
#Keep the dates before our backtest
data = data.iloc[:-((24 * 365) - 918),:]
data
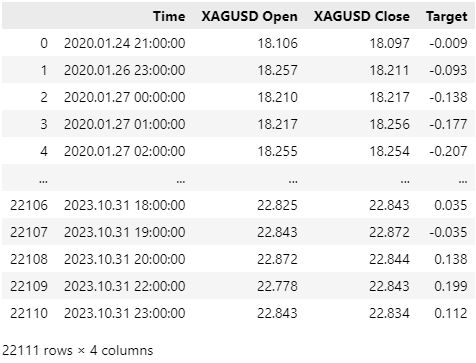
Fig 10: Make sure the training data you use for your statistical models, does not leak information from the future.
If we visualize the growth happening in the XAGUSD and the XAGEUR market, we observe the spread between the two markets grows and contracts as time passes. This may potentially indicate there are arbitrage opportunities that exist between these two markets. Otherwise, if no arbitrage opportunities existed, then the red and green line should've overlapped each other perfectly without ever drifting apart, from the beginning of time until this day. Needless to say, that is not the case. The two markets clearly decouple for some time, before they are subsequently corrected.
plt.title("Comparing XAGUSD & XAGEUR Growth")
plt.plot((data['XAGUSD Close'] / data.loc[0,"XAGUSD Close"]) / (data['XAGUSD Close'].max() - data['XAGUSD Close'].min()),color="red")
plt.plot((data['XAGEUR Close'] / data.loc[0,"XAGEUR Close"]) / (data['XAGEUR Close'].max() - data['XAGEUR Close'].min()),color="green")
plt.ylabel("Commodity Growth")
plt.xlabel("Time")
plt.legend(["XAGUSD","XAGEUR"])
plt.grid()
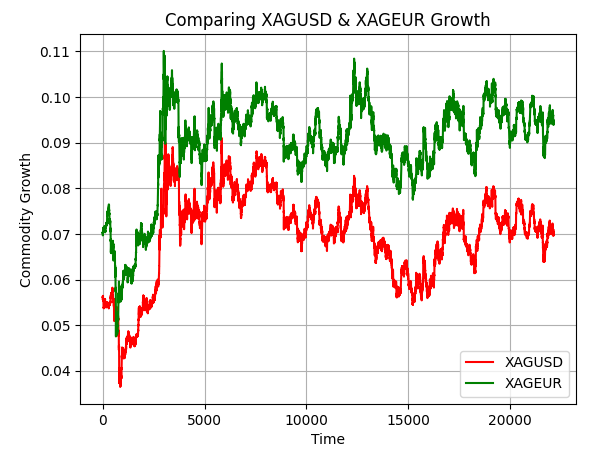
Fig 11: Visualizing our 2 financial markets overlaid on each other exposes potential arbitrage opportunities for us to exploit.
Label our inputs and the target.
X = data.iloc[:,1:-1].columns
y = "Target"
Prepare to fit a Gradient Boosting Tree onto our data and export it to ONNX format. Gradient Boosted Trees are renowned for their ability to detect interactions happening within a given dataset. We hope to take advantage of their powerful pattern detection capabilities to enhance our trading strategy.
import onnx
from skl2onnx import convert_sklearn
from skl2onnx.common.data_types import FloatTensorTypea
from sklearn.ensemble import GradientBoostingRegressor
Let us now build dedicated statistical models, for each market we are interested in. This will hopefully help us filter false breakouts. Fit each model on the data and export it to ONNX format so we can subsequently import all 3 of them into our MetaTrader 5 application.
Let us start by first rendering a model of the XAGUSD market.
model = GradientBoostingRegressor()
model.fit(data.loc[:,["XAGUSD Open","XAGUSD High","XAGUSD Low","XAGUSD Close"]],data.loc[:,y])
initial_types = [("float_input",FloatTensorType([1,4]))]
xagusd_model_proto = convert_sklearn(model,initial_types=initial_types,target_opset=12)
onnx.save(xagusd_model_proto,"../XAGUSD State Model.onnx")
Second, we will follow with the XAGEUR market.
model = GradientBoostingRegressor()
model.fit(data.loc[:,["XAGEUR Open","XAGEUR High","XAGEUR Low","XAGEUR Close"]],data.loc[:,"XAGEUR Target"])
initial_types = [("float_input",FloatTensorType([1,4]))]
xageur_model_proto = convert_sklearn(model,initial_types=initial_types,target_opset=12)
onnx.save(xageur_model_proto,"../XAGEUR State Model.onnx")
And lastly, we will export our statistical model of the EURUSD market.
model = GradientBoostingRegressor()
model.fit(data.loc[:,["EURUSD Open","EURUSD High","EURUSD Low","EURUSD Close"]],data.loc[:,"EURUSD Target"])
initial_types = [("float_input",FloatTensorType([1,4]))]
eurusd_model_proto = convert_sklearn(model,initial_types=initial_types,target_opset=12)
onnx.save(eurusd_model_proto,"../EURUSD State Model.onnx")
Our system will attribute more weight, to market moves that are backed by all three of our models in unison. We want to first observe the patterns we described in Fig 3 and Fig 4 forming in the market, followed by our three models forecasting that our patterns will not quickly fade, but they will hold over time. This will give us a reasonable measure of confidence, in the strength backing the market moves we are expecting to play out.
Implementing Our Improvements in MQL5
We can now start implementing our improvements to the original version of our trading strategy. First, we will add additional technical indicators into our arsenal, to give our computer better guidance and trend detection. The moving average cross-over is a good strategy for this task. However, we will use a more responsive version of the strategy, that minimizes the lag in the trading signals. Readers who are interested in learning more about this version of the moving average cross-over strategy, can learn more, here.
#define XAGUSD_MA_PERIOD 8
Load the ONNX models we have just built, as system resources.
//+------------------------------------------------------------------+
//| System resources                                                 |
//+------------------------------------------------------------------+
#resource "\\Files\\XAGUSD State Model.onnx" as  uchar xagusd_onnx_buffer[]
#resource "\\Files\\XAGEUR State Model.onnx" as  uchar xageur_onnx_buffer[]
#resource "\\Files\\EURUSD State Model.onnx" as  uchar eurusd_onnx_buffer[]
We will need new global variable that correspond to the moving average indicators we are introducing as well as the individual components needed to complete our ONNX model.
//+------------------------------------------------------------------+
//| Global variables                                                 |
//+------------------------------------------------------------------+
vector  eurusd,xagusd,xageur;
double  eurusd_growth,xagusd_growth,xageur_growth,bid,ask;
double  sl_width = 3e2 * _Point;
int     xagusd_f_ma_handler,xagusd_s_ma_handler;
double  xagusd_f[],xagusd_s[];
vectorf model_output = vectorf::Zeros(1);
long    onnx_model;
vectorf xageur_model_output = vectorf::Zeros(1);
long    xageur_onnx_model;
vectorf eurusd_model_output = vectorf::Zeros(1);
long    eurusd_onnx_model;
Some of our functions need to be refactored to meet our new expectations. To get started, when our trading application is no longer in use, we need to safely release the resources that were committed to our ONNX models and our two moving averages.
//+------------------------------------------------------------------+
//| Expert deinitialization function                                 |
//+------------------------------------------------------------------+
void OnDeinit(const int reason)
  {
//---
   OnnxRelease(onnx_model);
   OnnxRelease(xageur_onnx_model);
   OnnxRelease(eurusd_onnx_model);
   IndicatorRelease(xagusd_f_ma_handler);
   IndicatorRelease(xagusd_s_ma_handler);
   Print("System deinitialized");
  }
Additionally, our setup procedure also must accommodate our ONNX models and our technical indicators. We have to validate that our desired indicators and models have been loaded and specified correctly. Otherwise, we will break the initialization procedure and report what went wrong to the user.
//+------------------------------------------------------------------+
//| Setup our technical indicators and select the symbols we need    |
//+------------------------------------------------------------------+
bool setup(void)
  {
//--- Select the symbols we need
   SymbolSelect(SYMBOL_ONE,true);
   SymbolSelect(SYMBOL_TWO,true);
   SymbolSelect(SYMBOL_THREE,true);

//--- Setup the moving averages
   xagusd_f_ma_handler = iMA(SYMBOL_ONE,TF_1,XAGUSD_MA_PERIOD,0,MODE_SMA,PRICE_OPEN);
   xagusd_s_ma_handler = iMA(SYMBOL_ONE,TF_1,XAGUSD_MA_PERIOD,0,MODE_SMA,PRICE_CLOSE);

   if((xagusd_f_ma_handler == INVALID_HANDLE) || (xagusd_s_ma_handler == INVALID_HANDLE))
     {
      Comment("Failed to load our technical indicators correctly. ", GetLastError());
      return(false);
     }

//--- Setup our statistical models
   onnx_model        = OnnxCreateFromBuffer(xagusd_onnx_buffer,ONNX_DEFAULT);
   xageur_onnx_model = OnnxCreateFromBuffer(xageur_onnx_buffer,ONNX_DEFAULT);
   eurusd_onnx_model = OnnxCreateFromBuffer(eurusd_onnx_buffer,ONNX_DEFAULT);

   if(onnx_model == INVALID_HANDLE)
     {
      Comment("Failed to create our XAGUSD ONNX model correctly. ",GetLastError());
      return(false);
     }

   if(xageur_onnx_model == INVALID_HANDLE)
     {
      Comment("Failed to create our XAGEUR ONNX model correctly. ",GetLastError());
      return(false);
     }

   if(eurusd_onnx_model == INVALID_HANDLE)
     {
      Comment("Failed to create our EURUSD ONNX model correctly. ",GetLastError());
      return(false);
     }

   ulong input_shape[] = {1,4};
   ulong output_shape[] = {1,1};

   if(!(OnnxSetInputShape(onnx_model,0,input_shape)))
     {
      Comment("Failed to specify XAGUSD model input shape. ",GetLastError());
      return(false);
     }


   if(!(OnnxSetInputShape(xageur_onnx_model,0,input_shape)))
     {
      Comment("Failed to specify XAGEUR model input shape. ",GetLastError());
      return(false);
     }


   if(!(OnnxSetInputShape(eurusd_onnx_model,0,input_shape)))
     {
      Comment("Failed to specify EURUSD model input shape. ",GetLastError());
      return(false);
     }

   if(!(OnnxSetOutputShape(onnx_model,0,output_shape)))
     {
      Comment("Failed to specify XAGUSD model output shape. ",GetLastError());
      return(false);
     }

   if(!(OnnxSetOutputShape(xageur_onnx_model,0,output_shape)))
     {
      Comment("Failed to specify XAGEUR model output shape. ",GetLastError());
      return(false);
     }

   if(!(OnnxSetOutputShape(eurusd_onnx_model,0,output_shape)))
     {
      Comment("Failed to specify EURUSD model output shape. ",GetLastError());
      return(false);
     }

   Print("System initialized succefully");

//--- If we have gotten this far, everything went fine.
   return(true);
  }
We will also need a dedicated function for fetching predictions from our ONNX model. Our function will first prepare the ONNX model's inputs, and then call the OnnxRun function to get a prediction from our model.
//+------------------------------------------------------------------+
//| Fetch a prediction from our model                                |
//+------------------------------------------------------------------+
void model_predict(void)
  {
   vectorf model_inputs =  { (float) iOpen(SYMBOL_ONE,TF_1,1), (float) iClose(SYMBOL_ONE,TF_1,1)};
   OnnxRun(onnx_model,ONNX_DATA_TYPE_FLOAT,model_inputs,model_output);
   Print(StringFormat("Model forecast: %d",model_output));
  }
Our procedure for finding a trade setup must also be revised. The first step to be taken is obtaining a forecast from our model, once complete, we then seek additional confirmation from our moving average cross-overs. Recall that our specific version of the moving average cross-overs, places one moving average on the Open price, and the latter on the Close price, both moving averages sharing the same period. When the Open moving average is on top, we interpret that as a short signal. If not, we go long.
Therefore, our final condition, will be that our Gradient Boosted Regressor, expects price action to be consistent with both signals we have observed. If this is the case, we will consider this a high probability trade setup, and double our lot-size. Otherwise, we will trade conservatively.
//+------------------------------------------------------------------+
//| Find setup                                                       |
//+------------------------------------------------------------------+
void find_setup(void)
  {
   model_predict();

//--- Check if the current market setup matches our expectations for selling
   if((eurusd_growth < 1) && (xageur_growth > 1) && (xagusd_growth <  1))
     {
      if(xagusd_s[0] < xagusd_f[0])
        {
         if(model_output[0] < 0)
           {
            //--- If all our systems align, we have a high probability trade setup
            Trade.Sell(VOLUME * 2,SYMBOL_ONE,bid,(ask + sl_width),(ask - sl_width),"");
           }
         //--- Otherwise, we should trade conservatively
         Trade.Sell(VOLUME,SYMBOL_ONE,bid,(ask + sl_width),(ask - sl_width),"");
        }
     }

//--- Check if the current market setup matches our expectations for buying
   if((eurusd_growth > 1) && (xageur_growth < 1) && (xagusd_growth > 1))
     {
      if(xagusd_s[0] > xagusd_f[0])
        {
         if(model_output[0] > 0)
           {
            Trade.Buy(VOLUME * 2,SYMBOL_ONE,ask,(bid - sl_width),(bid + sl_width),"");
           }

         Trade.Buy(VOLUME,SYMBOL_ONE,ask,(bid - sl_width),(bid + sl_width),"");
        }
     }
  }
Let us now repeat the same test we performed, but this time, we will use our refined version of the trading strategy. Recall that our we made sure, our back test dates, do not overlap with the dates we used to train our statistical models.
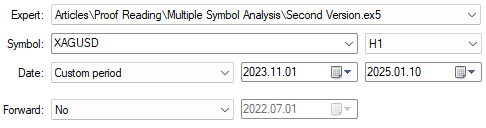
Fig 12: We are using the same testing period in both tests. Additionally, none of our statistical models have seen this data before.
As the reader would expect, all settings will be kept constant, to ensure a fair comparison of both trading strategies.
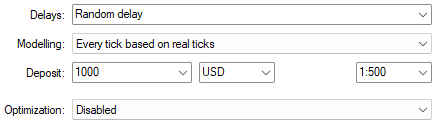
Fig 13: Ideally, these settings should be kept the same across both tests you perform.
Let us now analyze the results we have obtained. In our initial back-test, we demonstrated a Sharpe ratio of 0.14, while our revised strategy demonstrates a Sharpe ratio of 1.85. This is a significant improvement in our Sharpe ratio, meaning that we have effectively managed to be more profitable, while taking on additional risk responsibly. Low Sharpe ratios, are associated, with high variance on low returns.
Moreover, our average loss fell from around $115 per trade to around $109 per trade, while our average profit, on the other hand, grew from $188 on average, to $213 on average. This is positive feedback for us. Our total profit also grew from $395 in our first iteration of the strategy to $1 449 in this current iteration. All of this, while taking on fewer trades than our manually configured version of the strategy.
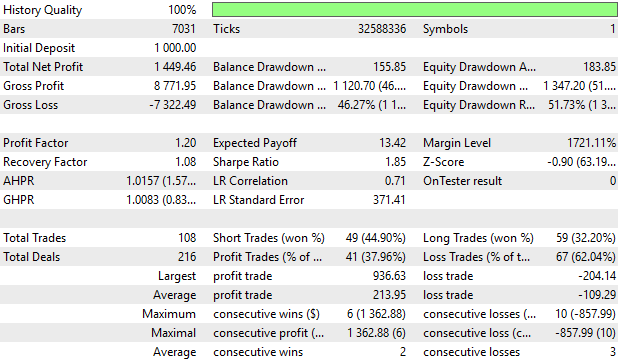
Fig 14: A detailed summary of the historical performance of our trading strategy on the XAGUSD market.
The changes, we have applied to our system, rectified the unstable swings in account balance we observed in the initial version of our strategy. According to our back-test, on average, our new strategy tends to profit more, than it tends to lose on each trade. This gives our new profit and loss curve shallower low periods, than the depths of the losses accumulated in the original and riskier version of our trading strategy.
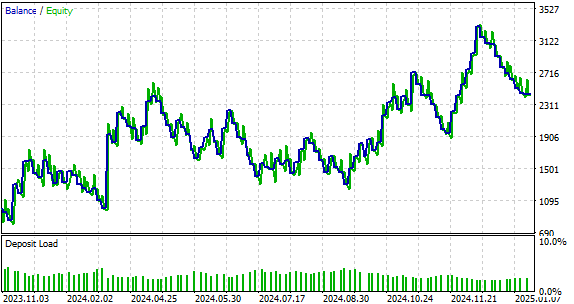
Fig 15: Visualizing the profit and loss curve produced by our revised version of the trading strategy.
Conclusion
After reading this article, the reader will hopefully gain an algorithmic strategy, for trading interconnected markets. The reader will walk away with an understanding of how to blend their domain expertise to find and profitably trade triangular markets. Using statistical models, the reader can better find the exact trade setups he is looking for. By taking advantage of the interconnected nature of certain markets, we can always forge real-time indicators of true market strength.
| Attached File Name | Description |
|---|---|
| Baseline_Model | Our initial version of the triangular trading strategy. |
| Second Version | The revised and more profitable version of our trading strategy. |
| EURUSD State Model | Our statistical model of the EURUSD market. |
| XAGEUR State Model | Our statistical model of the XAGEUR market. |
| XAGUSD State Model | Our statistical model of the XAGUSD market. |
| Triangular Exchange Rates | The Jupyter notebook we used, to analyze our market data and build our statistical models of the market. |
Warning: All rights to these materials are reserved by MetaQuotes Ltd. Copying or reprinting of these materials in whole or in part is prohibited.
This article was written by a user of the site and reflects their personal views. MetaQuotes Ltd is not responsible for the accuracy of the information presented, nor for any consequences resulting from the use of the solutions, strategies or recommendations described.

- Free trading apps
- Over 8,000 signals for copying
- Economic news for exploring financial markets
You agree to website policy and terms of use