
Build Self Optimizing Expert Advisors in MQL5 (Part 5): Self Adapting Trading Rules
Technical indicators have become an indispensable tool in most algorithmic trading applications because of the well-defined trading signals they offer, allowing for rapid development of applications. Regrettably, it is common for traders to find themselves facing adversarial market conditions that deviate from the standardized rules on how to use any technical indicator.
For example, the Relative Strength Indicator is used to measure the strength of changes in price levels in a given market. It is widely recognized as best practice for traders to set their buy entries when the RSI gives readings are below 30, and sell entries when RSI readings higher than 70 are observed.
In Fig 1, below, we have applied a 20 period RSI to the Daily price of Gold in US Dollars. The reader can remark that neither of the expected readings were observed for an extended duration of 3 months. We can observe from looking at the trend line drawn on the chart, that from September 2019 until December 2019, the price of Gold was in a strong downtrend.
However, if the reader pays closer attention, he will notice that during this downtrend period, our RSI Indicator did not produce the expected signals to enter a short position.
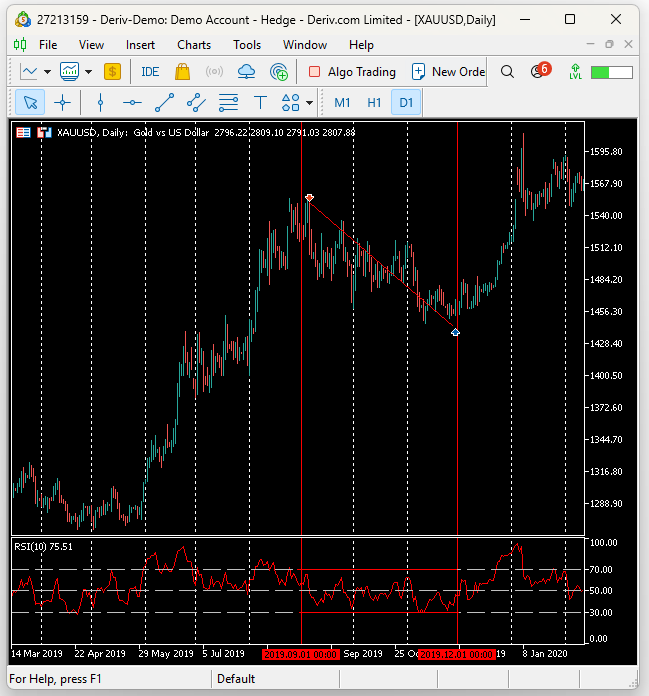
Fig 1: It is possible for market conditions to fail to produce the expected reading from a technical indicator, leading to unintended behavior.
Some readers may rationalize that "You can try to adjust your period accordingly, and you will obtain the standardized result". However, adjusting the period is not always a valid solution. For example, members of our community interested in multiple symbol analysis, may have specific periods that best expose the cross market pattern they are looking for, and hence the need to keep their periods fixed.
Additionally, readers that only trade a single market at a time must bear in mind, that increasing the RSI Period, will make the problem worse. Likewise, decreasing the RSI period picks up more noise from the market and reduces the overall quality of the trading signals.
Briefly, casually approaching this problem may result in unintended behavior of trading applications, resulting in missed profits from opportunities not taken, or higher than expected market exposure, due to exit conditions not being fully satisfied.
Overview Of The Methodology
It is clear that we need to design applications in a manner that allows them to adapt their trading rules to the historical data on hand. We will discuss our proposed solution in detail in the subsequent sections of this article. For now, our proposed solution can best be summarized by reasoning that, for you to know what a strong move is, you must first know what an average move looks like in that particular market. That way, the reader can set their applications to only take entry signals that are above average, or even better to be more specific and select moves that are 2 or 3 times above average.
By setting our trading signals to be decided relative to the size of an average move, we will effectively eliminate the possibility of going through extended durations of time without receiving a trading signal, and hopefully put to rest the need to endlessly optimize the period of the RSI calculation.
Getting Started in MQL5
Our exploration begins by establishing a baseline performance level using the MetaTrader 5 Strategy Tester. Our strategy will be used as scaffolding the reader is intended to replace with their private trading strategies. We will build a strategy in MQL5 that trades breakouts from key support or resistance levels. Our RSI will give us confirmation that the level has been cleared successfully. We will fix the size of our Stop Loss and Take Profits across all versions of the application to ensure that changes in profitability, are coming directly from us making better decisions.
There are various definitions of what defines a valid support or resistance level. But for our discussions, it will be enough for us to know that a support level, is a low price level that generated a rally in price action. And conversely, resistance levels are price levels of interest that produced a strong bearish trend on our charts. The exact duration that these levels will hold true is not known at the beginning of any trading session.
When either of these levels are successfully broken, they are typically followed by volatile price action. Our RSI will be our guide to decide if we should place a trade when the observed breakout is in action. We are looking for opportunities to enter long positions, when price levels have broken below key support levels, and to only take short positions, if the opposite is true on the resistance level.
Our support and resistance levels, will be found by comparing the current price levels, against their respective levels 5 days ago.
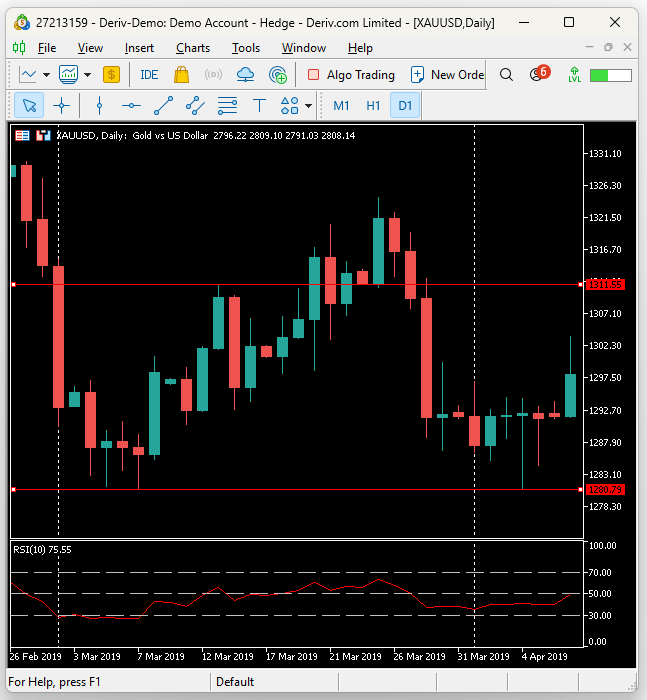
Fig 2: Visualizing support and resistance levels on the XAGUSD
Some parameters of our discussion will remain fixed. Therefore, to avoid unnecessary duplication of the same information, we will discuss these fixed parameters here. Our discussion will take aim to trade breakouts in support and resistance levels, on the Daily price of Silver in US Dollars (XAGUSD). We will test our strategy over M15 historical data from 1st of January 2017 until 28 January 2025.

Fig 3: The time period which we will use for our back tests
Additionally, we will use "Random delay" settings during our back test, as this is similar to the experience of real trading. And we have selected "Every tick based on real ticks" to perform our tests on actual market data, retrieved from our broker.

Fig 4: The second batch of fixed settings in our back test today
With this out of the way, we can now focus our attention on building our baseline application using MQL5. We will begin by first defining critical system constants that will not be altered during our conversation. These system constants define parameters that control the behavior of our trading application, such as how wide the stop loss and take profit should be, which time frames to use and the size of each position we take, just to name a few jobs.
//+------------------------------------------------------------------+
//|                                  Self Adapting Trading Rules.mq5 |
//|                                               Gamuchirai Ndawana |
//|                    https://www.mql5.com/en/users/gamuchiraindawa |
//+------------------------------------------------------------------+
#property copyright "Gamuchirai Ndawana"
#property link      "https://www.mql5.com/en/users/gamuchiraindawa"
#property version   "1.00"

//+------------------------------------------------------------------+
//| System constants                                                 |
//+------------------------------------------------------------------+
#define RSI_PERIOD 10              //The period for our RSI indicator
#define RSI_PRICE  PRICE_CLOSE     //The price level our RSI should be applied to
#define ATR_SIZE   1.5             //How wide should our Stop loss be?
#define ATR_PERIOD 14              //The period of calculation for our ATR indicator
#define TF_1       PERIOD_D1       //The primary time frame for our trading application
#define TF_2       PERIOD_M15      //The secondary time frame for our trading application
#define VOL        0.1             //Our trading volume
Now we shall import the trade library to help us manage our positions.
//+------------------------------------------------------------------+
//| Libraries we need                                                |
//+------------------------------------------------------------------+
#include <Trade/Trade.mqh>
CTrade Trade;
Next we need to define a few important global variables.
//+------------------------------------------------------------------+
//| Global variables                                                 |
//+------------------------------------------------------------------+
int rsi_handler,atr_handler;
double rsi[],atr[];
double support,resistance;
Our MetaTrader 5 applications are mainly driven by events that happen in our Terminal. We have built custom methods that will be called, in turn when each Terminal event is triggered.
//+------------------------------------------------------------------+
//| Expert initialization function                                   |
//+------------------------------------------------------------------+
int OnInit()
  {
//---
   setup();
//---
   return(INIT_SUCCEEDED);
  }
//+------------------------------------------------------------------+
//| Expert deinitialization function                                 |
//+------------------------------------------------------------------+
void OnDeinit(const int reason)
  {
//---
   release();
  }
//+------------------------------------------------------------------+
//| Expert tick function                                             |
//+------------------------------------------------------------------+
void OnTick()
  {
//---
   update();
  }
//+------------------------------------------------------------------+
When our indicator is loaded for the first time, we will set up our technical indicators and then set our support and resistance levels to the highest and lowest price levels we observed the previous week.
//+------------------------------------------------------------------+
//| User defined methods                                             |
//+------------------------------------------------------------------+

//+------------------------------------------------------------------+
//| Initialize our system variables                                  |
//+------------------------------------------------------------------+
void setup(void)
  {
//Load our technical indicators
   atr_handler = iATR(Symbol(),TF_1,ATR_PERIOD);
   rsi_handler = iRSI(Symbol(),TF_2,RSI_PERIOD,RSI_PRICE);
   resistance  = iHigh(Symbol(),TF_1,5);
   support     = iLow(Symbol(),TF_1,5);
  }
If our trading application is no longer in use, we need to release the technical indicators we are no longer using.
//+------------------------------------------------------------------+
//| Let go of resources we are no longer consuming                   |
//+------------------------------------------------------------------+
void release(void)
  {
//Free up resources we are not using
   IndicatorRelease(atr_handler);
   IndicatorRelease(rsi_handler);
  }
Our update function is split into 2 parts. The first half, handles routine tasks that need to be performed once per-day, while the latter half handles tasks that need to be performed frequently on a lower time frame. This assures us that we will be blindsided by abrupt or abnormal market behavior.
//+------------------------------------------------------------------+
//| Update our system variables and look for trading setups          |
//+------------------------------------------------------------------+
void update(void)
  {
//Update our system variables
//Some duties must be performed periodically on the higher time frame
     {
      static datetime time_stamp;
      datetime current_time = iTime(Symbol(),TF_1,0);

      //Update the time
      if(time_stamp != current_time)
        {
         time_stamp = current_time;

         //Update indicator readings
         CopyBuffer(rsi_handler,0,0,1,rsi);
         CopyBuffer(atr_handler,0,0,1,atr);

         //Update our support and resistance levels
         support    = iLow(Symbol(),TF_1,5);
         resistance = iHigh(Symbol(),TF_1,5);
         ObjectDelete(0,"Support");
         ObjectDelete(0,"Resistance");
         ObjectCreate(0,"Suppoprt",OBJ_HLINE,0,0,support);
         ObjectCreate(0,"Resistance",OBJ_HLINE,0,0,resistance);
        }
     }

//While other duties need more attention, and must be handled on lower time frames.
     {
      static datetime time_stamp;
      datetime current_time = iTime(Symbol(),TF_2,0);
      double bid,ask;

      //Update the time
      if(time_stamp != current_time)
        {
         time_stamp = current_time;
         bid=SymbolInfoDouble(Symbol(),SYMBOL_BID);
         ask=SymbolInfoDouble(Symbol(),SYMBOL_ASK);

         //Check if we have broken either extreme
         if(PositionsTotal() == 0)
            {
               //We are looking for opportunities to sell
               if(iLow(Symbol(),TF_2,0) > resistance)
                  {
                     if(rsi[0] > 70) Trade.Sell(VOL,Symbol(),bid,(ask + (ATR_SIZE * atr[0])),(ask - (ATR_SIZE * atr[0])));
                  }

              //We are looking for opportunities to buy
              if(iHigh(Symbol(),TF_2,0) < support)
                  {
                     if(rsi[0] < 30) Trade.Buy(VOL,Symbol(),ask,(bid - (ATR_SIZE * atr[0])),(bid + (ATR_SIZE * atr[0])));
                  }
            }
         }
        }
     }
Lastly, we must undefine the system constants we defined at the beginning of the application.
//+------------------------------------------------------------------+
//| Undefine the system constants                                    |
//+------------------------------------------------------------------+
#undef RSI_PERIOD
#undef RSI_PRICE
#undef ATR_PERIOD
#undef ATR_SIZE
#undef TF_1
#undef TF_2
#undef VOL
//+------------------------------------------------------------------+
Altogether, this is what our current codebase looks like.
//+------------------------------------------------------------------+
//|                                  Self Adapting Trading Rules.mq5 |
//|                                               Gamuchirai Ndawana |
//|                    https://www.mql5.com/en/users/gamuchiraindawa |
//+------------------------------------------------------------------+
#property copyright "Gamuchirai Ndawana"
#property link      "https://www.mql5.com/en/users/gamuchiraindawa"
#property version   "1.00"

//+------------------------------------------------------------------+
//| System constants                                                 |
//+------------------------------------------------------------------+
#define RSI_PERIOD 10            //The period for our RSI indicator
#define RSI_PRICE  PRICE_CLOSE   //The price level our RSI should be applied to
#define ATR_SIZE   1.5             //How wide should our Stop loss be?
#define ATR_PERIOD 14            //The period of calculation for our ATR indicator
#define TF_1       PERIOD_D1     //The primary time frame for our trading application
#define TF_2       PERIOD_M15    //The secondary time frame for our trading application
#define VOL        0.1           //Our trading volume

//+------------------------------------------------------------------+
//| Libraries we need                                                |
//+------------------------------------------------------------------+
#include <Trade/Trade.mqh>
CTrade Trade;

//+------------------------------------------------------------------+
//| Global variables                                                 |
//+------------------------------------------------------------------+
int rsi_handler,atr_handler;
double rsi[],atr[];
double support,resistance;

//+------------------------------------------------------------------+
//| Expert initialization function                                   |
//+------------------------------------------------------------------+
int OnInit()
  {
//---
   setup();
//---
   return(INIT_SUCCEEDED);
  }
//+------------------------------------------------------------------+
//| Expert deinitialization function                                 |
//+------------------------------------------------------------------+
void OnDeinit(const int reason)
  {
//---
   release();
  }
//+------------------------------------------------------------------+
//| Expert tick function                                             |
//+------------------------------------------------------------------+
void OnTick()
  {
//---
   update();
  }
//+------------------------------------------------------------------+

//+------------------------------------------------------------------+
//| User defined methods                                             |
//+------------------------------------------------------------------+

//+------------------------------------------------------------------+
//| Initialize our system variables                                  |
//+------------------------------------------------------------------+
void setup(void)
  {
//Load our technical indicators
   atr_handler = iATR(Symbol(),TF_1,ATR_PERIOD);
   rsi_handler = iRSI(Symbol(),TF_2,RSI_PERIOD,RSI_PRICE);
   resistance  = iHigh(Symbol(),TF_1,5);
   support     = iLow(Symbol(),TF_1,5);
  }

//+------------------------------------------------------------------+
//| Let go of resources we are no longer consuming                   |
//+------------------------------------------------------------------+
void release(void)
  {
//Free up resources we are not using
   IndicatorRelease(atr_handler);
   IndicatorRelease(rsi_handler);
  }

//+------------------------------------------------------------------+
//| Update our system variables and look for trading setups          |
//+------------------------------------------------------------------+
void update(void)
  {
//Update our system variables
//Some duties must be performed periodically on the higher time frame
     {
      static datetime time_stamp;
      datetime current_time = iTime(Symbol(),TF_1,0);

      //Update the time
      if(time_stamp != current_time)
        {
         time_stamp = current_time;

         //Update indicator readings
         CopyBuffer(rsi_handler,0,0,1,rsi);
         CopyBuffer(atr_handler,0,0,1,atr);

         //Update our support and resistance levels
         support    = iLow(Symbol(),TF_1,5);
         resistance = iHigh(Symbol(),TF_1,5);
         ObjectDelete(0,"Support");
         ObjectDelete(0,"Resistance");
         ObjectCreate(0,"Suppoprt",OBJ_HLINE,0,0,support);
         ObjectCreate(0,"Resistance",OBJ_HLINE,0,0,resistance);
        }
     }

//While other duties need more attention, and must be handled on lower time frames.
     {
      static datetime time_stamp;
      datetime current_time = iTime(Symbol(),TF_2,0);
      double bid,ask;

      //Update the time
      if(time_stamp != current_time)
        {
         time_stamp = current_time;
         bid=SymbolInfoDouble(Symbol(),SYMBOL_BID);
         ask=SymbolInfoDouble(Symbol(),SYMBOL_ASK);

         //Check if we have broken either extreme
         if(PositionsTotal() == 0)
           {
            //We are looking for opportunities to sell
            if(iLow(Symbol(),TF_2,0) > resistance)
              {
               if(rsi[0] > 70)
                  Trade.Sell(VOL,Symbol(),bid,(ask + (ATR_SIZE * atr[0])),(ask - (ATR_SIZE * atr[0])));
              }

            //We are looking for opportunities to buy
            if(iHigh(Symbol(),TF_2,0) < support)
              {
               if(rsi[0] < 30)
                  Trade.Buy(VOL,Symbol(),ask,(bid - (ATR_SIZE * atr[0])),(bid + (ATR_SIZE * atr[0])));
              }
           }
        }
     }
  }

//+------------------------------------------------------------------+
//| Undefine the system constants                                    |
//+------------------------------------------------------------------+
#undef RSI_PERIOD
#undef RSI_PRICE
#undef ATR_PERIOD
#undef ATR_SIZE
#undef TF_1
#undef TF_2
#undef VOL
//+------------------------------------------------------------------+
Let us now assess how well this algorithm performs on historical market data. Launch your MetaTrader 5 terminal and select the application we have just developed together. Recall that test dates and settings are provided for you at the beginning of this section of the article.

Fig 5: Starting our back-test in MetaTrader 5
Our expert advisor has no input parameters, once you have loaded the application and set the test dates accordingly, launch the MetaTrader 5 Strategy Tester. Fig 6, below, is the equity curve produced by following the classical trading rules built for the RSI.
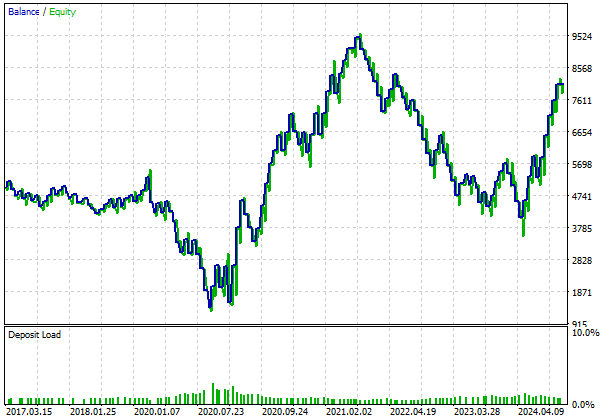
Fig 6: The equity curve produced by following the classical RSI trading strategy
Fig 7, provides us a detailed summary of how our RSI based trading application performed on the first test. Our total net profit was $588.60 with a Sharpe ratio of 0.85. These results are encouraging so far, and will serve as our target to outperform through the next iteration of our trading application.
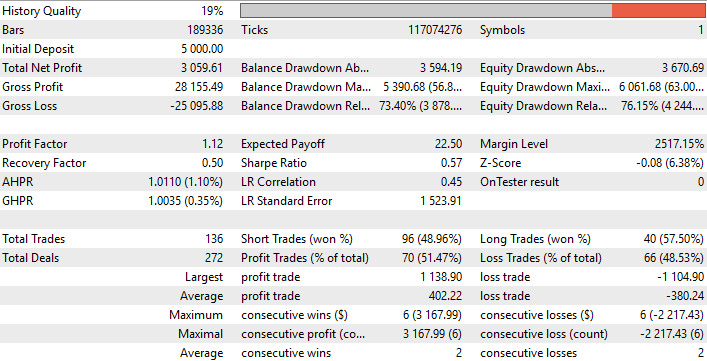
Fig 7: A detailed summary of the results we obtained from our back test
Improving Our Initial Results
We have now arrived at the proposed solution that addresses the potential problems brought about by non-standard outputs from the indicator. To replace the classical 70 and 30 levels with optimum levels selected directly from the historical performance of the market, we must first observe the range of outputs the indicator generates on the given market. Afterward, we will bisect the 2 parallel lines that mark the maximum and minimum output generated by the indicator. This bisecting line becomes our new midpoint. Note that originally, the midpoint of the RSI indicator, is the 50 level.
Once we have calculated our new mid-point, we will record the absolute difference of each RSI reading from the midpoint of the indicator, and average these out to obtain our estimation of an average move in that particular market. We will subsequently instruct our trading application to only enter its positions, if it observes a change in the RSI value 2 times greater than an average move in that market. This new parameter, lets us control how sensitive our trading application is, but if we select values that are too large, such as 100, our application will not place any trades, ever.
To implement these changes in our application, we have to make the following changes:
| Proposed Change | Intended Purpose |
|---|---|
| Creating new system constants | These new system constants will fix most of the parameters from the initial version of the application, while introducing a few new ones we need. |
| Modification of our user-defined methods | The custom functions we wrote earlier need to be extended, to provide the new functionality we desire. |
To get started, let us first create the new system constants we need. We need to dynamically decide how many bars should be used in the calculations we want to perform. This will be the responsibility of the new system constant titled "BARS". It will return an integer close to half the total number of bars available. Additionally, we have also decided that we are only interested in changes in the RSI that are 2 times greater than average. Therefore, we have created a new constant called "BIG SIZE" that records the intended strength we want to observe behind our moves.
Lastly, our support and resistance levels will be found by comparing the current price with its value a week ago, or 5 days ago.
//+---------------------------------------------------------------+
//| System constants                                              |
//+---------------------------------------------------------------+
#define RSI_PERIOD     10                                          //The period for our RSI indicator
#define RSI_PRICE      PRICE_CLOSE                                 //The price level our RSI should be applied to
#define ATR_SIZE       1.5                                         //How wide should our Stop loss be?
#define ATR_PERIOD     14                                          //The period of calculation for our ATR indicator
#define TF_1           PERIOD_D1                                   //The primary time frame for our trading application
#define TF_2           PERIOD_M15                                  //The secondary time frame for our trading application
#define VOL            0.1                                         //Our trading volume
#define BARS           (int) MathFloor((iBars(Symbol(),TF_2) / 2)) //How many bars should we use for our calculation?
#define BIG_SIZE       2                                           //How many times bigger than the average move should the observed change be?
#define SUPPORT_PERIOD 5                                           //How far back into the past should we look to find our support and resistance levels?
Now, we will modify the conditions that define if we will open our positions. Notice that we no longer place our entries on fixed indicator levels, but rather on calculated levels, that are derived from the indicator's memory buffer.
//While other duties need more attention, and must be handled on lower time frames.
     {
      static datetime time_stamp;
      datetime current_time = iTime(Symbol(),TF_2,0);
      double bid,ask;

      //Update the time
      if(time_stamp != current_time)
        {
         time_stamp = current_time;
         bid=SymbolInfoDouble(Symbol(),SYMBOL_BID);
         ask=SymbolInfoDouble(Symbol(),SYMBOL_ASK);

         //Copy the rsi readings into a vector
         vector rsi_vector   = vector::Zeros(BARS);
         rsi_vector.CopyIndicatorBuffer(rsi_handler,0,1,BARS);

         //Let's see how far the RSI tends to deviate from its centre
         double rsi_midpoint = ((rsi_vector.Max() + rsi_vector.Min()) / 2);
         vector rsi_growth   = MathAbs(rsi_vector - rsi_midpoint);

         //Check if we have broken either extreme
         if(PositionsTotal() == 0)
           {
            //We are looking for opportunities to sell
            if(iLow(Symbol(),TF_2,0) > resistance)
              {
               if((rsi[0] - rsi_midpoint) > (rsi_growth.Mean() * BIG_SIZE))
                  Trade.Sell(VOL,Symbol(),bid,(ask + (ATR_SIZE * atr[0])),(ask - (ATR_SIZE * atr[0])));
              }

            //We are looking for opportunities to buy
            if(iHigh(Symbol(),TF_2,0) < support)
              {
               if((rsi[0] - rsi_midpoint) < (-(rsi_growth.Mean() * BIG_SIZE)))
                  Trade.Buy(VOL,Symbol(),ask,(bid - (ATR_SIZE * atr[0])),(bid + (ATR_SIZE * atr[0])));
              }
           }
        }
     }
Lastly, we need to undefine the new system constants we created.
//+------------------------------------------------------------------+
//| Undefine the system constants                                    |
//+------------------------------------------------------------------+
#undef RSI_PERIOD
#undef RSI_PRICE
#undef ATR_PERIOD
#undef ATR_SIZE
#undef TF_1
#undef TF_2
#undef VOL
#undef BARS
#undef BIG_SIZE
#undef SUPPORT_PERIOD
//+------------------------------------------------------------------+
We are now ready to test out our new dynamic trading rules for the RSI. Be sure to select the appropriate version of the Expert Advisor in your strategy tester before launching the test. Remember that the date settings will be the same as those we stated in the introduction of the article.

Fig 8: Select the right version of the trading application for our test
The equity curve produced by our new version of the RSI trading algorithm appears similar to the initial results we obtained. However, let us analyze the detailed summary of the results to get a clear perspective on what difference has been made.
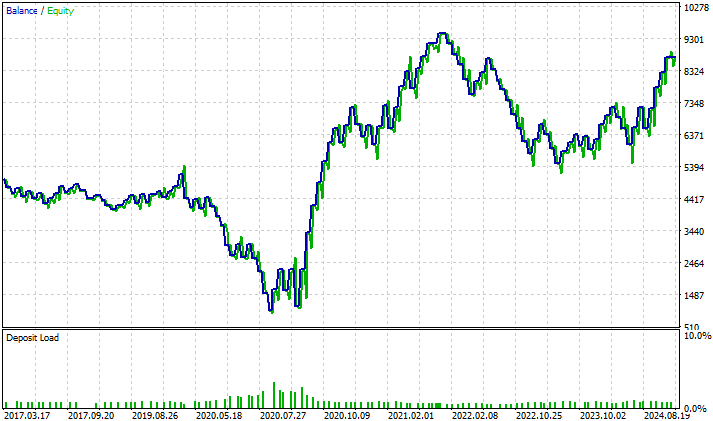
Fig 9: The equity curve produced by our version of the dynamic rules trading algorithm
In our initial test, our total net profit was $588.60 made over 136 total trades. Our new strategy produced a profit of $703.20 over 121 trades. Therefore, our profitability has increased by approximately 19.5% while on the other hand, the total number of trades we placed fell by about 11%. It is evident that our new system is giving us a clear competitive edge over the classical rules that define how we should typically use the indicator.
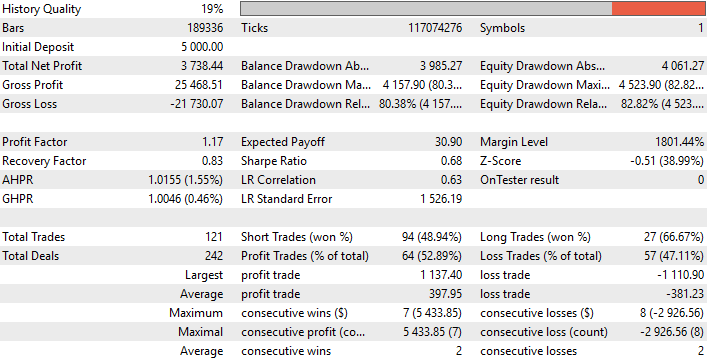
Fig 10: The detailed results summarizing the performance of our new trading strategy
Conclusion
The solution we explored today has furnished you with a design pattern on how to use your MetaTrader 5 terminal to give you a refined level of control over the sensitivity of your trading applications. Traders that analyze multiple symbols will benefit from a new perspective on how to compare the strength of changes in price levels across different markets in an objective manner that is thought-out and eliminates the chances of unintended bugs that may easily derail their efforts.
Additionally, our proposed algorithm for carefully substituting the classical 30 and 70 levels, with optimal levels selected directly from the observed range of the indicator when it is applied to any particular market may give us a material edge over casual market participants waiting for the standardized result to be observed.
| Attached File | Description |
|---|---|
| Self Adapting Trading Rules | Benchmark version of our trading application with static and fixed rules. |
| Self Adapting Trading Rules V2 | Refined version of our trading application that adapts its rules based on the market data available. |
Warning: All rights to these materials are reserved by MetaQuotes Ltd. Copying or reprinting of these materials in whole or in part is prohibited.
This article was written by a user of the site and reflects their personal views. MetaQuotes Ltd is not responsible for the accuracy of the information presented, nor for any consequences resulting from the use of the solutions, strategies or recommendations described.
 Neural Networks in Trading: Reducing Memory Consumption with Adam-mini Optimization
 Developing a Replay System (Part 57): Understanding a Test Service
 Trend Prediction with LSTM for Trend-Following Strategies
 Automating Trading Strategies in MQL5 (Part 5): Developing the Adaptive Crossover RSI Trading Suite Strategy
- Free trading apps
- Over 8,000 signals for copying
- Economic news for exploring financial markets
You agree to website policy and terms of use