

Market Simulation (Part 24): Position View (II)
 1 674
1 674
 0
0

Introduction
Hello and welcome everyone to another article in the series on how to create a replay/simulation system.
In the previous article, Market Simulation: Position View (I), we began discussing the possibility of creating and implementing an indicator that would allow us to visualize open positions directly on the symbol chart. Although many people consider this unnecessary because MetaTrader 5 already provides such functionality, that approach does not work when we use a cross-order execution model, or even, as in our specific case, a replay/simulation system.
As mentioned, when we start working with a large number of objects on the chart, some problems arise, especially when those objects are connected to each other in one way or another, which makes the overall implementation more complex. That said, our goal here is not to dwell on the problems we face, but to show the solution we decided to implement. What we are about to examine, as mentioned some time ago, will be neither the final solution nor the only possible one. I suggest, dear reader, that you stop for a moment and think before you start writing more and more pieces of code without a clear need.
Since the topic we are going to discuss is quite broad, we will not go into detail in this introduction. My intention is that, by the end of this article, we will have created something slightly better than what was covered in the previous publication. So let us get to work.
Preparing for the implementation
All right, the indicator we examined in the previous article showed data about a single open position. However, it did this in the terminal, in text form. This is not very appealing, since many people, myself included, want the information to be displayed directly on the chart. That will be the goal of this article. All we need to do is create a horizontal line object whose coordinate is the price, and set that coordinate to the price value we obtained in the previous article. Something very simple and easy to understand. However, some problems may arise. But we will go through everything step by step.
So first we will implement these lines. And yes, we need three lines that the position indicator will display. One line for the position opening price and two additional lines: one for the stop-loss level and another for the take-profit level. But to create these lines, we will use what has already been implemented in our replay/simulation code.
So, since you, dear reader, may want to organize this in some other way, let us start by creating a priority list. It can be seen in the following code:
01. //+------------------------------------------------------------------+
02. #property copyright "Daniel Jose"
03. //+------------------------------------------------------------------+
04. #define def_VERSION_DEBUG
05. //+------------------------------------------------------------------+
06. #ifdef def_VERSION_DEBUG
07.     #define macro_DEBUG_MODE(A) \
08.                     Print(__FILE__, " ", __LINE__, " ", __FUNCTION__ + " " + #A + " = " + (string)(A));
09. #else
10.     #define macro_DEBUG_MODE(A)
11. #endif
12. //+------------------------------------------------------------------+
13. #define def_SymbolReplay           "RePlay"
14. #define def_MaxPosSlider           400
15. #define def_MaskTimeService        0xFED00000
16. #define def_IndicatorTimeFrame     (_Period < 60 ? _Period : (_Period < PERIOD_D1 ? _Period - 16325 : (_Period == PERIOD_D1 ? 84 : (_Period == PERIOD_W1 ? 91 : 96))))
17. #define def_IndexTimeFrame         4
18. //+------------------------------------------------------------------+
19. union uCast_Double
20. {
21.     double   dValue;
22.     long     _long;                                   // 1 Information
23.     datetime _datetime;                               // 1 Information
24.     uint     _32b[sizeof(double) / sizeof(uint)];     // 2 Informations
25.     ushort   _16b[sizeof(double) / sizeof(ushort)];   // 4 Informations
26.     uchar    _8b [sizeof(double) / sizeof(uchar)];    // 8 Informations
27. };
28. //+------------------------------------------------------------------+
29. enum EnumEvents     {
30.             evTicTac,                         //Tick-tock event
31.             evHideMouse,                      //Hide mouse price line
32.             evShowMouse,                      //Show mouse price line
33.             evHideBarTime,                    //Hide bar time
34.             evShowBarTime,                    //Show bar time
35.             evHideDailyVar,                   //Hide daily variation
36.             evShowDailyVar,                   //Show daily variation
37.             evHidePriceVar,                   //Hide instantaneous variation
38.             evShowPriceVar,                   //Show instantaneous variation
39.             evCtrlReplayInit,                 //Initialize replay control
40.             evChartTradeBuy,                  //Market buy event
41.             evChartTradeSell,                 //Market sell event
42.             evChartTradeCloseAll,             //Event to close positions
43.             evChartTrade_At_EA,               //Event for communication with the EA
44.             evEA_At_ChartTrade,               //Event for communication with Chart Trade
45.             evChatWriteSocket,                //Event to Mini Chat
46.             evChatReadSocket                  //Event To Mini Chat
47.                         };
48. //+------------------------------------------------------------------+
49. enum EnumPriority {                           //Priority list on objects
50.             ePriorityNull = -1,
51.             ePriorityDefault = 0,
52.             ePriorityChartTrade = 5,
53.             ePriorityOrders = 10
54.                         };
55. //+------------------------------------------------------------------+
Source code of the Defines.mqh file
Notice the change we made to the Defines.mqh file. It consists of adding the enumeration on line 49. But why? The reason is simple: as I mentioned in the previous article, graphical objects may end up overlapping each other. The worst case is when two line-type objects completely overlap. In such a case, there is no quick and simple way to select one of the objects. However, if we tell MetaTrader 5 that even objects of the same type will have different priorities, MetaTrader 5 will take this into account when selecting overlapping objects and will give priority to the object with the higher value. Even so, be careful when doing this. I do not want you to get into the habit of assigning higher and higher priority values to your own objects at the expense of others.
Notice that we define four priority levels. The first level is the one that will be assigned to all objects created by our applications that do not require high priority. That is the value -1. Line 51, on the other hand, indicates the value that MetaTrader 5 normally uses when the user adds an object to the chart. In other words, such objects receive a value of zero. Since some objects may have a certain level of transparency and may end up at the top of the list during chart redrawing, they can partially hide Chart Trade. However, be careful, because even if the Chart Trade panel is completely hidden, that is, located behind some object, when you click the area where it is located, MetaTrader 5 will give priority to it rather than to the object in the foreground.
This is achieved by assigning it a priority of five. The same happens on line 53. Notice that there is a difference in priority between Chart Trade and the objects we will create shortly. This margin allows us to add other priority levels if that becomes necessary. Thus, according to the model just presented, the objects that will become part of the order and position visualization system will have the highest priority of all. You can change this if you wish, but keep in mind what I have just mentioned.
Good. Having done this, we will need to make two more changes to the existing code. But do not worry or be alarmed by this. These are very simple changes, needed only so that this list can be used. Let us now modify the code of the C_Terminal class. The place that needs to be changed can be seen in the following fragment.
201. //+------------------------------------------------------------------+
202. inline void CreateObjectGraphics(const string szName, const ENUM_OBJECT obj, const color cor = clrNONE, const EnumPriority zOrder = ePriorityNull) const
203.             {
204.                 ChartSetInteger(m_Infos.ID, CHART_EVENT_OBJECT_CREATE, 0, false);
205.                  ObjectCreate(m_Infos.ID, szName, obj, m_Infos.SubWin, 0, 0);
206.
Fragment from the C_Terminal class
Line 202 should be updated to the version shown here. What we are doing here is simply making this function use the priority list we have just defined. Another fragment that needs to be changed can also be seen in the following fragment. It is located in the C_ChartFloatingRAD class.
164. //+------------------------------------------------------------------+
165.         template <typename T >
166.         void CreateObjectEditable(eObjectsIDE arg, T value)
167.             {
168.                 DeleteObjectEdit();
169.                 CreateObjectGraphics(m_Info.szObj_Editable, OBJ_EDIT, clrBlack, ePriorityChartTrade);
170.                 ObjectSetInteger(m_Init.id, m_Info.szObj_Editable, OBJPROP_XDISTANCE, m_Info.Regions[arg].x + m_Info.x + 3);
171.                 ObjectSetInteger(m_Init.id, m_Info.szObj_Editable, OBJPROP_YDISTANCE, m_Info.Regions[arg].y + m_Info.y + 3);
Fragment from the C_ChartFloatingRAD class
The change must be made on line 169. We need to replace the original line with the line shown in the previous fragment. This means that if we ever change the priority list and recompile the applications, the Chart Trade indicator will automatically switch to using the new priority if its own priority has been changed. As a result, we no longer need to change anything else in the existing code, and we can start working on the new indicator.
Starting the implementation of the new objects
Before moving on to more complex code, let us slow down so that you can follow my line of reasoning. We will therefore start with the code below, which is merely an improvement of the code we examined in the previous article.
01. //+------------------------------------------------------------------+
02. #property copyright "Daniel Jose"
03. #property description "Indicator for tracking an open position on the server."
04. #property version   "1.00"
05. #property indicator_chart_window
06. #property indicator_plots 0
07. //+------------------------------------------------------------------+
08. #define def_SufixLinePrice   "Price"
09. #define def_SufixLineTake    "Take"
10. #define def_SufixLineStop    "Stop"
11. //+------------------------------------------------------------------+
12. #include <Market Replay\Auxiliar\C_Terminal.mqh>
13. //+------------------------------------------------------------------+
14. input color user00 = clrBlue;               //Color Line Price
15. input color user01 = clrForestGreen;        //Color Line Take Profit
16. input color user02 = clrFireBrick;          //Color Line Stop Loss
17. //+------------------------------------------------------------------+
18. C_Terminal *Terminal;
19. struct st
20. {
21.     long       id;
22.     string     szPrefixName;
23. }glVariables;
24. //+------------------------------------------------------------------+
25. void CreateLinePriceOpen(const string szObjName)
26. {
27.     (*Terminal).CreateObjectGraphics(szObjName, OBJ_HLINE, user00, ePriorityNull);
28.     ObjectSetDouble(glVariables.id, szObjName, OBJPROP_PRICE, PositionGetDouble(POSITION_PRICE_OPEN));
29. }
30. //+------------------------------------------------------------------+
31. int OnInit()
32. {
33.     ZeroMemory(glVariables);
34.     Terminal = new C_Terminal();
35.     if (!PositionSelect((*Terminal).GetInfoTerminal().szSymbol)) return INIT_FAILED;
36.     glVariables.id = (*Terminal).GetInfoTerminal().ID;
37.     glVariables.szPrefixName = IntegerToString(PositionGetInteger(POSITION_TICKET));
38.     CreateLinePriceOpen(glVariables.szPrefixName + def_SufixLinePrice);
39.
40.     return INIT_SUCCEEDED;
41. }
42. //+------------------------------------------------------------------+
43. int OnCalculate(const int rates_total, const int prev_calculated, const int begin, const double &price[])
44. {
45.     return rates_total;
46. }
47. //+------------------------------------------------------------------+
48. void OnDeinit(const int reason)
49. {
50.     delete Terminal;
51.     if (glVariables.id > 0)
52.         ObjectsDeleteAll(glVariables.id, glVariables.szPrefixName);
53. }
54. //+------------------------------------------------------------------+
Source code of the position indicator
Excellent. Looking at the previous code, you are probably already thinking: "Well, now things have really started to get complicated." But no, we are still at the basic level. The code above will create only one line on the chart if there is an open position for the symbol on whose chart the indicator is installed. This code remains very simple, compact and contains no checks. The program simply creates an H_LINE object and displays it on the chart using the color specified by the user. Simple enough. But if you are used to placing objects on the chart using MQL5, you may be surprised that none of the calls you are used to seeing appears here. So the question arises: does this code really work? And if it does, how does it work?
Let us start with line 08. There we have a definition, just as in the next two lines, where we define the suffix for the line objects we are going to create. The reason for doing this will become clear later. In lines 14 to 16, we allow the user to change the colors that will be used for the lines. So far, nothing too complicated. However, this is where things start to get interesting. This happens on line 19, where we begin defining a structure that will later disappear. For now, however, we will do things this way, because you, dear reader, need to understand my line of reasoning. This way, you will be able to understand why I formulate it this way.
Let us skip the procedure on line 25 for now and move on to line 31. That is where the indicator begins working in MetaTrader 5. Notice that the first thing we do is zero out the memory of the glVariables structure. Why do this? The reason, as we have already said, is that this structure will later disappear. But even if it remains unchanged, we need to make sure that all variables present in the structure have an initial value of zero. Doing this with the call shown is easier than declaring variable after variable. And if I happen to forget one of them, it will certainly remain with a zero value.
All right. Lines 34 and 35 were already explained in the previous article, so we can skip them. Line 36, on the other hand, merely saves the value stored in the C_Terminal class for later use. Now we arrive at the main lines. On the first of them, that is, line 37, we define the value that will serve as the prefix of the name of the object being created, in this case an HLINE object. The value of this prefix is precisely the numeric value that identifies the position ticket. This ensures that there will be only one object with this name on the chart.
But since we will reuse this same value later, we need to do something so that MetaTrader 5 does not confuse the objects we are going to place on the chart and decide that the object already exists when in fact we are creating a new one. Now you are beginning to understand the definitions in lines 08 to 10. But let us return to the code, because we are now at line 38, where we call the procedure from line 25 for the following purpose: to create a line on the chart and place it at the position opening price.
Then let us go to the procedure on line 25 to understand a few things. At this stage, the code is still quite simple and easy to understand. This procedure receives the name that will be assigned to the HLINE object. But where do we create this object? We do it through the C_Terminal class, specifically on line 27. Now pay close attention to the following: in the fourth parameter of line 27, we use a very low priority, in fact, the lowest one in the list. Why?
You might think: "But is this line we are creating right now not part of the position and order indicator? Why is this object assigned a lower selection priority than the other objects? This makes no sense. In my opinion, the priority should be the one we listed as the priority for objects created by the position and order indicator." No, dear reader, thinking this way, especially in this specific case, is wrong, and the reason is simple. This horizontal line, and let this be absolutely clear, only this line, must have the lowest possible priority. The reason is simple: it will not be moved and should not receive events, because it represents the price or point at which the trading server indicates the open position. Now do you understand why this priority was assigned to it?
But you still should not relax. We have only created the line and positioned it on the chart. This positioning happens on line 28 of the previous code. That is all. If the user deletes, moves or even selects this line on the chart, they will be able to move it. This completely contradicts the principle we want to implement with this indicator. To solve this problem, we will need to implement more code. But since the goal here is to explain things as clearly as possible, we will do it gradually, so that you can understand why the object, which in this case is the price line, must not be moved.
In any case, when the indicator is removed from the chart, the check on line 51 is performed. If the condition is met, line 52 deletes all objects whose names begin with the prefix used in this code to create and display them on the chart. I hope this part is clear, because the same principle is used to add the horizontal lines indicating where the stop loss and take profit are located. However, there are a few differences, as can be seen in the following fragment:
01. //+------------------------------------------------------------------+
02. #property copyright "Daniel Jose"
03. #property description "Indicator for tracking an open position on the server."
04. #property version   "1.00"
05. #property indicator_chart_window
06. #property indicator_plots 0
07. //+------------------------------------------------------------------+
08. #define def_SufixLinePrice   "Price"
09. #define def_SufixLineTake    "Take"
10. #define def_SufixLineStop    "Stop"
11. //+------------------------------------------------------------------+
12. #include <Market Replay\Auxiliar\C_Terminal.mqh>
13. //+------------------------------------------------------------------+
14. input color user00 = clrBlue;               //Color Line Price
15. input color user01 = clrForestGreen;        //Color Line Take Profit
16. input color user02 = clrFireBrick;          //Color Line Stop Loss
17. //+------------------------------------------------------------------+
18. C_Terminal *Terminal;
19. struct st
20. {
21.     long       id;
22.     string     szPrefixName;
23. }glVariables;
24. //+------------------------------------------------------------------+
25. void CreateLinePriceOpen(const string szObjName)
26. {
27.     (*Terminal).CreateObjectGraphics(szObjName, OBJ_HLINE, user00, ePriorityNull);
28.     ObjectSetDouble(glVariables.id, szObjName, OBJPROP_PRICE, PositionGetDouble(POSITION_PRICE_OPEN));
29. }
30. //+------------------------------------------------------------------+
31. void CreateLineStopAndTake(const string szObjName, const double price, const color cor)
32. {
33.     if (price <= 0) return;
34.     (*Terminal).CreateObjectGraphics(szObjName, OBJ_HLINE, cor, ePriorityOrders);
35.     ObjectSetDouble(glVariables.id, szObjName, OBJPROP_PRICE, price);
36. }
37. //+------------------------------------------------------------------+
38. int OnInit()
39. {
40.     ZeroMemory(glVariables);
41.     Terminal = new C_Terminal();
42.     if (!PositionSelect((*Terminal).GetInfoTerminal().szSymbol)) return INIT_FAILED;
43.     glVariables.id = (*Terminal).GetInfoTerminal().ID;
44.     glVariables.szPrefixName = IntegerToString(PositionGetInteger(POSITION_TICKET));
45.     CreateLinePriceOpen(glVariables.szPrefixName + def_SufixLinePrice);
46.     CreateLineStopAndTake(glVariables.szPrefixName + def_SufixLineTake, PositionGetDouble(POSITION_TP), user01);
47.     CreateLineStopAndTake(glVariables.szPrefixName + def_SufixLineStop, PositionGetDouble(POSITION_SL), user02);
48.
49.     return INIT_SUCCEEDED;
50. }
51. //+------------------------------------------------------------------+
52. int OnCalculate(const int rates_total, const int prev_calculated, const int begin, const double &price[])
53. {
54.     return rates_total;
55. }
56. //+------------------------------------------------------------------+
57. void OnDeinit(const int reason)
58. {
59.     delete Terminal;
60.     if (glVariables.id > 0)
61.         ObjectsDeleteAll(glVariables.id, glVariables.szPrefixName);
62. }
63. //+------------------------------------------------------------------+
Source code of the position indicator
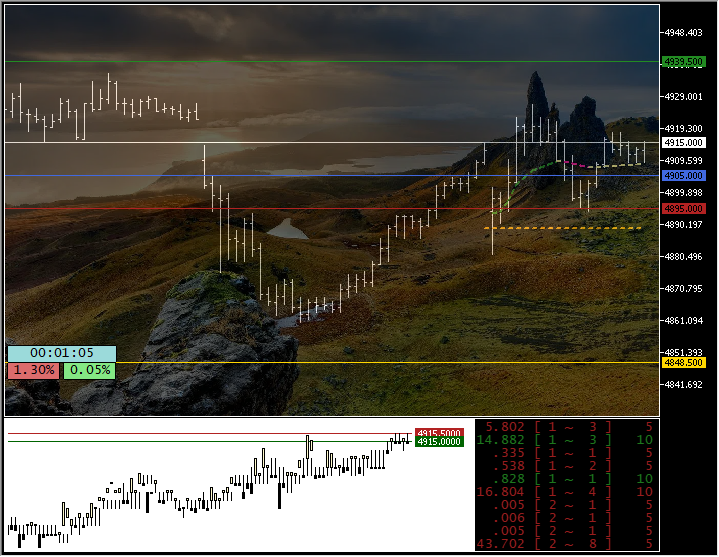
Please note that very little code has been added. However, now, if you use this application on a chart where only one position is open for the symbol, you will be able to see where the opening price, take profit and stop loss are located. So let us see what was added to the code to make this visualization possible.
Now, on line 31, we have a new procedure. This is the procedure that will create the horizontal take profit and stop loss lines. Notice that it is practically the same procedure as the one that creates the opening price line. But why did I keep them separate? I did this so that you would understand that the opening price line must have a different priority from the other lines, which in this case are the take profit and stop loss lines. One more detail: on line 33, we check that the price value is not equal to zero and is not less than zero, since that would make no sense. In that case, the horizontal line object will not be created.
But even after adding the ability for the indicator to place two more lines on the chart, when the indicator is removed, all lines created by it will also be removed. Thus, we only needed to add lines 46 and 47 to the code for everything to be complete, at least in its most basic form. As a result, you will be able to see the following image when the indicator is on the chart and a position is open.
But before moving on to something even more complex, let us add some text so that we can know what each line on the chart represents, because without this we may be tempted to delete it manually through the MetaTrader 5 Objects window. This window can be seen in the following image:
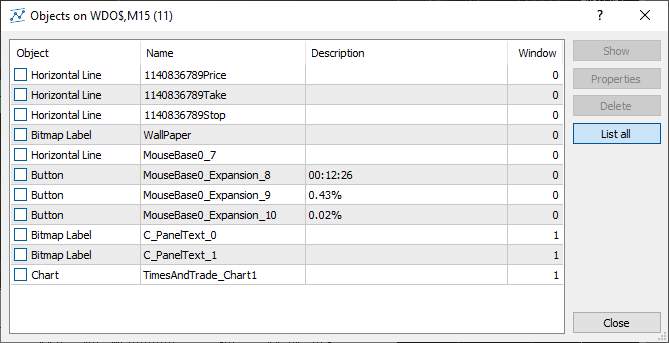
Here we can see all objects present on the chart, regardless of whether they are hidden or not. However, if an object is present on the chart in any way, it will appear in this list. And we do not want the user to delete one of these objects simply because they do not know its purpose. So we will make a small change to the code. This change can be made in two places: here, in the indicator, or in the C_Terminal class. However, to be honest, I do not want to keep changing a class that is already fully stable by introducing possible instabilities into it without a good reason. So, since we will need to change the state of some properties of the newly created objects, let us do it here locally.
Continuing to improve the code
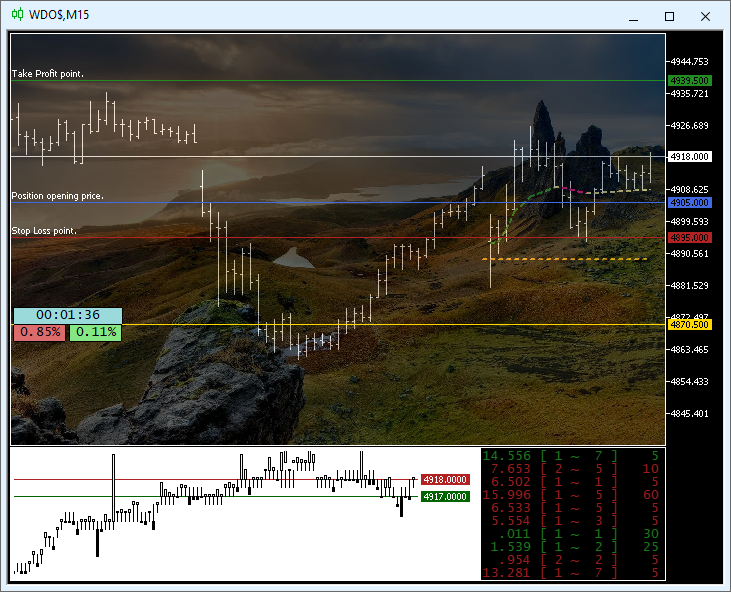
One thing we can add so that the user understands what a given object is and what it is for is the object description. This is very simple to do. We simply replace the code above with the code shown below:
01. //+------------------------------------------------------------------+
02. #property copyright "Daniel Jose"
03. #property description "Indicator for tracking an open position on the server."
04. #property version   "1.00"
05. #property indicator_chart_window
06. #property indicator_plots 0
07. //+------------------------------------------------------------------+
08. #define def_SufixLinePrice   "Price"
09. #define def_SufixLineTake    "Take"
10. #define def_SufixLineStop    "Stop"
11. //+------------------------------------------------------------------+
12. #include <Market Replay\Auxiliar\C_Terminal.mqh>
13. //+------------------------------------------------------------------+
14. input color user00 = clrRoyalBlue;          //Color Line Price
15. input color user01 = clrForestGreen;        //Color Line Take Profit
16. input color user02 = clrFireBrick;          //Color Line Stop Loss
17. //+------------------------------------------------------------------+
18. C_Terminal *Terminal;
19. struct st
20. {
21.     long       id;
22.     string     szPrefixName;
23. }glVariables;
24. //+------------------------------------------------------------------+
25. void CreateLinePriceOpen(const string szObjName, const string szDescription = "\n")
26. {
27.     (*Terminal).CreateObjectGraphics(szObjName, OBJ_HLINE, user00, ePriorityNull);
28.     ObjectSetDouble(glVariables.id, szObjName, OBJPROP_PRICE, PositionGetDouble(POSITION_PRICE_OPEN));
29.     ObjectSetString(glVariables.id, szObjName, OBJPROP_TEXT, szDescription);
30.     ObjectSetString(glVariables.id, szObjName, OBJPROP_TOOLTIP, szDescription);
31. }
32. //+------------------------------------------------------------------+
33. void CreateLineStopAndTake(const string szObjName, const double price, const color cor, const string szDescription = "\n")
34. {
35.     if (price <= 0) return;
36.     (*Terminal).CreateObjectGraphics(szObjName, OBJ_HLINE, cor, ePriorityOrders);
37.     ObjectSetDouble(glVariables.id, szObjName, OBJPROP_PRICE, price);
38.     ObjectSetString(glVariables.id, szObjName, OBJPROP_TEXT, szDescription);
39.     ObjectSetString(glVariables.id, szObjName, OBJPROP_TOOLTIP, szDescription);
40. }
41. //+------------------------------------------------------------------+
42. int OnInit()
43. {
44.     ZeroMemory(glVariables);
45.     Terminal = new C_Terminal();
46.     if (!PositionSelect((*Terminal).GetInfoTerminal().szSymbol)) return INIT_FAILED;
47.     glVariables.id = (*Terminal).GetInfoTerminal().ID;
48.     glVariables.szPrefixName = IntegerToString(PositionGetInteger(POSITION_TICKET));
49.     CreateLinePriceOpen(glVariables.szPrefixName + def_SufixLinePrice, "Position opening price.");
50.     CreateLineStopAndTake(glVariables.szPrefixName + def_SufixLineTake, PositionGetDouble(POSITION_TP), user01, "Take Profit point.");
51.     CreateLineStopAndTake(glVariables.szPrefixName + def_SufixLineStop, PositionGetDouble(POSITION_SL), user02, "Stop Loss point.");
52.
53.     return INIT_SUCCEEDED;
54. }
55. //+------------------------------------------------------------------+
56. int OnCalculate(const int rates_total, const int prev_calculated, const int begin, const double &price[])
57. {
58.     return rates_total;
59. }
60. //+------------------------------------------------------------------+
61. void OnDeinit(const int reason)
62. {
63.     delete Terminal;
64.     if (glVariables.id > 0)
65.         ObjectsDeleteAll(glVariables.id, glVariables.szPrefixName);
66. }
67. //+------------------------------------------------------------------+
Source code of the position indicator
Once again, note that only a very small amount of code had to be added to obtain the result shown in the following image.
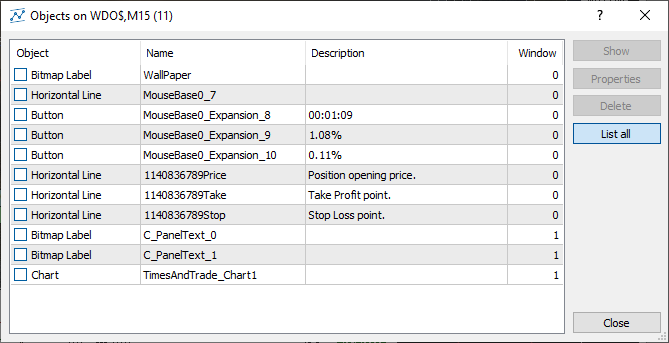
And also in the object list, where the following now appears:
Remember: for the text to be displayed on the chart as shown in the image above, the following option must be enabled in the chart settings:
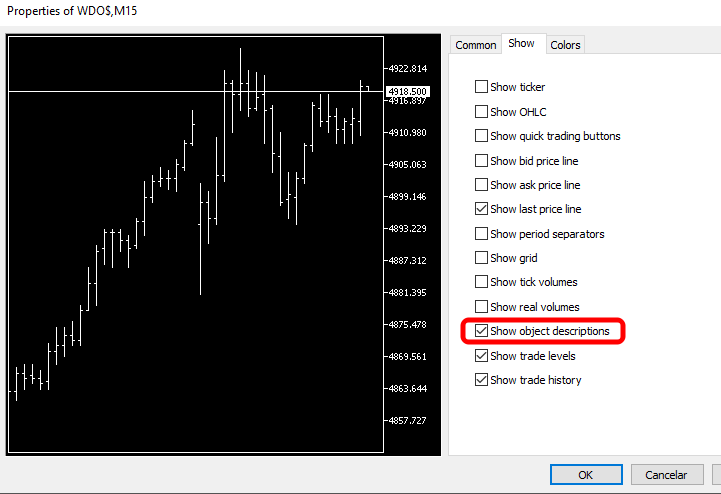
This property can also be enabled from MQL5 code. To do this, you only need to add one line of code to the program:
41. //+------------------------------------------------------------------+
42. int OnInit()
43. {
44.     ZeroMemory(glVariables);
45.     Terminal = new C_Terminal();
46.     if (!PositionSelect((*Terminal).GetInfoTerminal().szSymbol)) return INIT_FAILED;
47.     glVariables.id = (*Terminal).GetInfoTerminal().ID;
48.     ChartSetInteger(glVariables.id, CHART_SHOW_OBJECT_DESCR, true);
49.     glVariables.szPrefixName = IntegerToString(PositionGetInteger(POSITION_TICKET));
50.     CreateLinePriceOpen(glVariables.szPrefixName + def_SufixLinePrice, "Position opening price.");
51.     CreateLineStopAndTake(glVariables.szPrefixName + def_SufixLineTake, PositionGetDouble(POSITION_TP), user01, "Take Profit point.");
52.     CreateLineStopAndTake(glVariables.szPrefixName + def_SufixLineStop, PositionGetDouble(POSITION_SL), user02, "Stop Loss point.");
53.
54.     return INIT_SUCCEEDED;
55. }
56. //+------------------------------------------------------------------+
Main code fragment
Note that the added line is specifically line 48. This enables the same option shown in the image above. However, since this adds one more element that the code would have to analyze in order to avoid changing user settings that you, as the programmer, might not want to change, I will not use it in the final version of the code. But if you want to do this, you can do so without any problem. Similarly, you can also change the color in which the text is displayed. This is done in the next item marked in the image below:
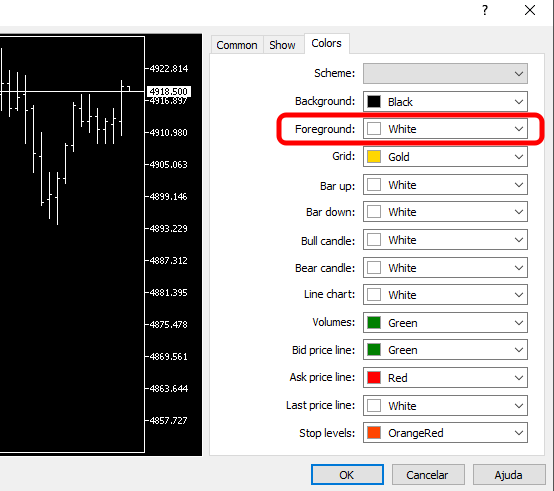
We can also change this property using MQL5 code. But again, I do not want to interfere with or change settings the user is already used to. I want to make as little effort as possible to achieve the intended goal. But, returning to the main code, dear reader, you need to pay attention to something: both in the declaration of the CreateLinePriceOpen procedure and in the declaration of the CreateLineStopAndTake procedure, the szDescription value is assigned a specific value. If no description is specified for the object, it will receive a description whose value is "\n". This is stated in the MQL5 documentation, which says the following:
The "tooltip" text. If the property is not defined, a tooltip automatically generated by the terminal will be displayed. The tooltip can be disabled by assigning it the value "\n" (line feed).
Thus, this default value received by szDescription will not actually affect the information placed in the OBJPROP_TEXT property on lines 29 and 38. However, it will prevent the MetaTrader 5 terminal from generating a value for the OBJPROP_TOOLTIP property declared on lines 30 and 39.
"How do we access the OBJPROP_TOOLTIP property? Is it not the same as OBJPROP_TEXT?" No, they are not the same. The OBJPROP_TEXT property is exactly what we see when an object allows text to be added to it. One of the objects that allows this is the horizontal line. However, this property is not present in all objects.
But the OBJPROP_TOOLTIP property will be present in all chart objects, and the description text of the two properties does not necessarily have to match. They may differ, because OBJPROP_TOOLTIP displays its text only when the cursor hovers over the object for a while. At that moment, a small window appears with the contents of the OBJPROP_TOOLTIP property.
If you had not noticed this before, the animation below shows what this small window is for, as well as how to view the contents of the OBJPROP_TOOLTIP property.
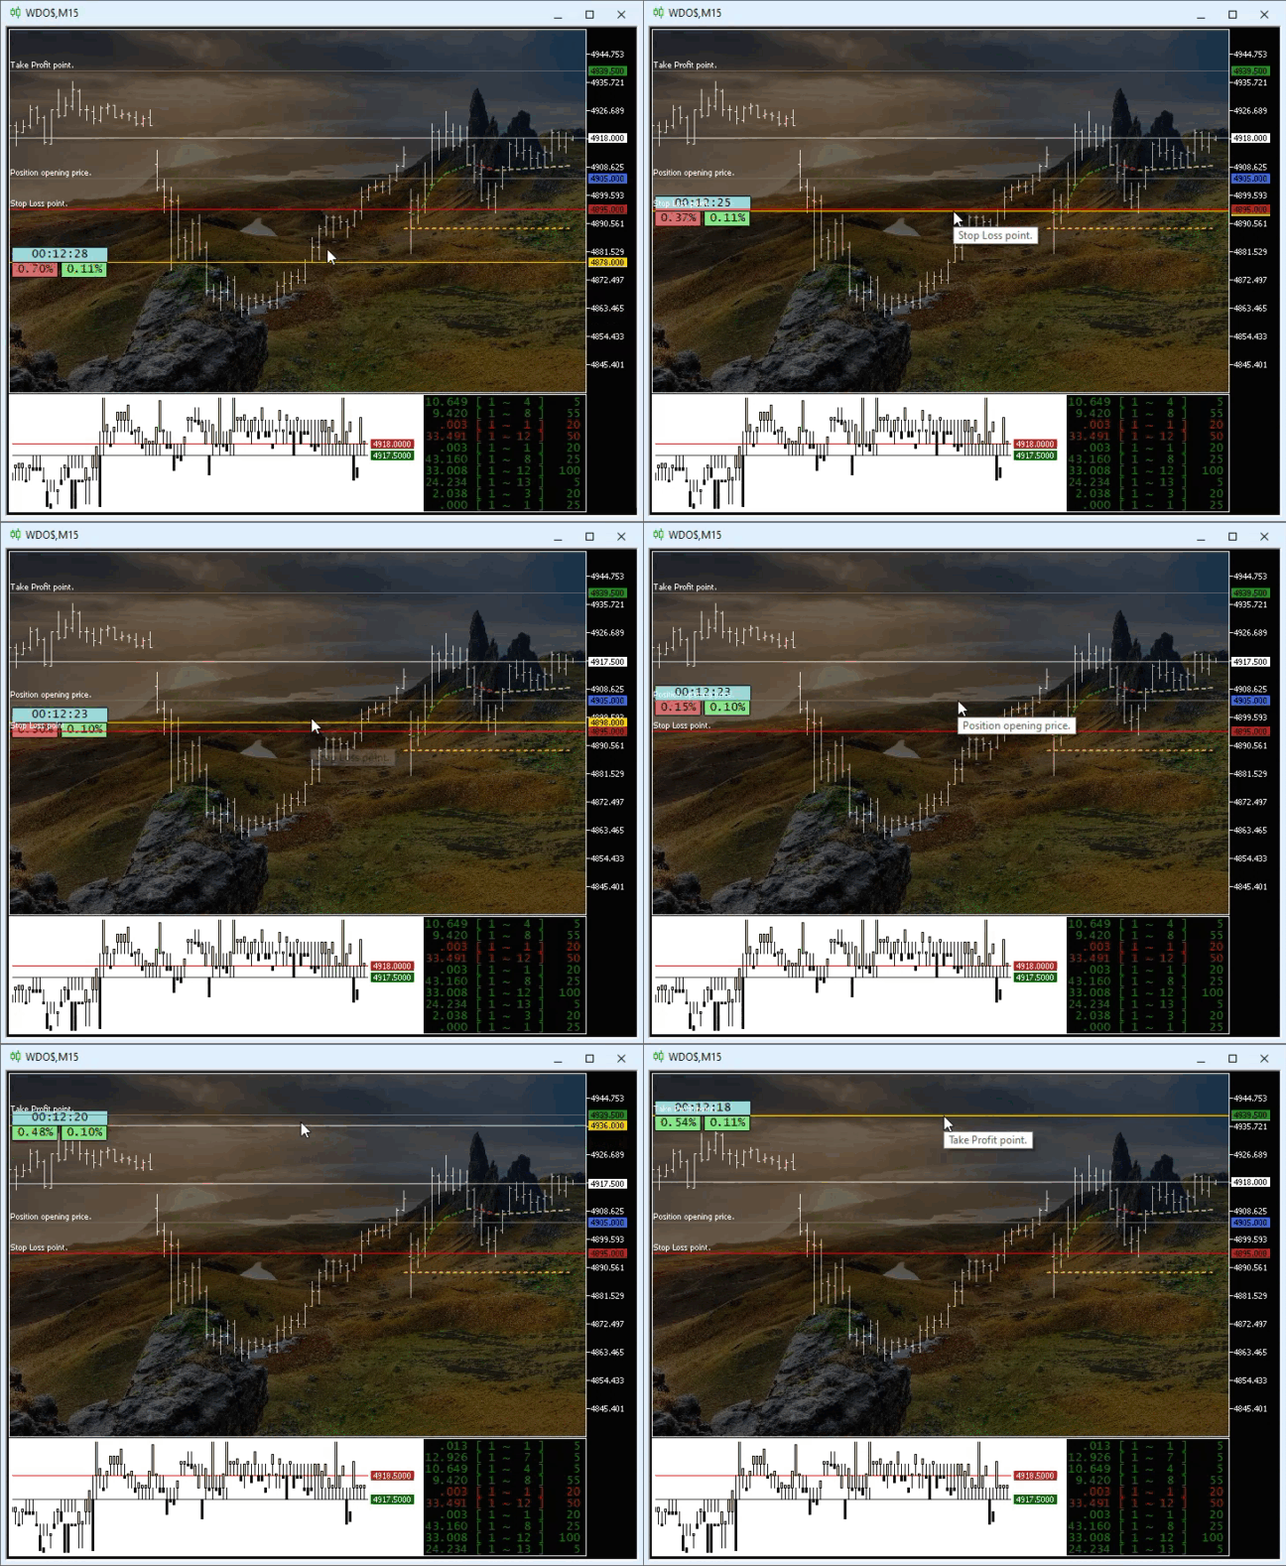
Please note that this feature serves as an auxiliary tool in terms of its content, interaction model, and purpose. It is something simple, direct and practical for many situations in general. All objects can receive some information through this property. If you want to help users understand how your application works, especially when it contains many buttons that often appear as icons or images, use this property to provide the user with the necessary help. They will be very grateful, since this will improve their experience with your application. Keep this in mind.
So, we are approaching the end of this article, but before we finish, how about combining the creation of the lines into a single procedure? This will save time and effort in the future, since we will use other methods to move these lines. So, the final code that will be used in the next article is shown below:
01. //+------------------------------------------------------------------+
02. #property copyright "Daniel Jose"
03. #property description "Indicator for tracking an open position on the server."
04. #property version   "1.00"
05. #property indicator_chart_window
06. #property indicator_plots 0
07. //+------------------------------------------------------------------+
08. #define def_SufixLinePrice   "Price"
09. #define def_SufixLineTake    "Take"
10. #define def_SufixLineStop    "Stop"
11. //+------------------------------------------------------------------+
12. #include <Market Replay\Auxiliar\C_Terminal.mqh>
13. //+------------------------------------------------------------------+
14. input color user00 = clrRoyalBlue;          //Color Line Price
15. input color user01 = clrForestGreen;        //Color Line Take Profit
16. input color user02 = clrFireBrick;          //Color Line Stop Loss
17. //+------------------------------------------------------------------+
18. C_Terminal *Terminal;
19. struct st
20. {
21.     long       id;
22.     string     szPrefixName;
23. }glVariables;
24. //+------------------------------------------------------------------+
25. void CreateLineInfos(const string szObjName, const double price, const color cor, const string szDescription = "\n")
26. {
27.     if (price <= 0) return;
28.     (*Terminal).CreateObjectGraphics(szObjName, OBJ_HLINE, cor, (EnumPriority)(cor == user00 ? ePriorityNull : ePriorityOrders))
29.     ObjectSetDouble(glVariables.id, szObjName, OBJPROP_PRICE, price);
30.     ObjectSetString(glVariables.id, szObjName, OBJPROP_TEXT, szDescription);
31.     ObjectSetString(glVariables.id, szObjName, OBJPROP_TOOLTIP, szDescription);
32.     ObjectSetInteger(glVariables.id, szObjName, OBJPROP_SELECTABLE, cor != user00);
33. }
34. //+------------------------------------------------------------------+
35. int OnInit()
36. {
37.     ZeroMemory(glVariables);
38.     Terminal = new C_Terminal();
39.     if (!PositionSelect((*Terminal).GetInfoTerminal().szSymbol)) return INIT_FAILED;
40.     glVariables.id = (*Terminal).GetInfoTerminal().ID;
41.     glVariables.szPrefixName = IntegerToString(PositionGetInteger(POSITION_TICKET));
42.     CreateLineInfos(glVariables.szPrefixName + def_SufixLinePrice, PositionGetDouble(POSITION_PRICE_OPEN), user00, "Position opening price.");
43.     CreateLineInfos(glVariables.szPrefixName + def_SufixLineTake, PositionGetDouble(POSITION_TP), user01, "Take Profit point.");
44.     CreateLineInfos(glVariables.szPrefixName + def_SufixLineStop, PositionGetDouble(POSITION_SL), user02, "Stop Loss point.");
45.
46.     return INIT_SUCCEEDED;
47. }
48. //+------------------------------------------------------------------+
49. int OnCalculate(const int rates_total, const int prev_calculated, const int begin, const double &price[])
50. {
51.     return rates_total;
52. }
53. //+------------------------------------------------------------------+
54. void OnDeinit(const int reason)
55. {
56.     delete Terminal;
57.     if (glVariables.id > 0)
58.         ObjectsDeleteAll(glVariables.id, glVariables.szPrefixName);
59. }
60. //+------------------------------------------------------------------+
Source code of the position indicator
This is the code we will modify in the next article. Since nothing substantial has changed, I think that simply by reading this article and thinking about it a little, you will easily understand how it works. The only note, and here I must warn you: do not use the same color for all three lines. You may even use the same color for the stop loss and take profit lines, but do not use the same color for the opening price line. This is because on line 28, as well as on line 32, we use color as a way to distinguish things. However, this is not a major issue. It may only confuse you and prevent you from understanding why things are not going as you expect.
Final thoughts
In this article, I tried to show, as simply and clearly as possible, how an indicator can be used to monitor open positions on the trading server. We did it this way, gradually, to show that you do not have to include all of this in an Expert Advisor. Many of you have probably become used to doing that for one reason or another. But in fact, that approach does not make much sense, because as this implementation evolves it will become clear that different types of indicators can be created or implemented to track and interact with positions or orders registered on the server or, in our case, in the replay/simulation system.
However, although the main idea here is to use the indicator in the replay/simulation system, I want you to notice that we have not yet applied it to the simulated symbol or to a situation where we are running the replay. I am using and testing the indicator on real symbols and real positions. Therefore, there is no point in using it only in the replay/simulation system. I want to warn you about the following precaution when using it: it will display only one position. In the case of HEDGING accounts, it is not enough to have two or more open positions and expect the indicator to work, because it is not yet capable of doing so.
Soon we will see the correct way to use this indicator, allowing more than one open position to be visualized. In the case of NETTING accounts, you will not have this problem, because they do not allow you to buy and sell the same symbol at the same time. HEDGING accounts, however, do allow this. In this specific case, we will need to make a small adjustment to the way this indicator is used. But the implementation cost is so low that, honestly, it is worth considering offloading this work from the Expert Advisor. This is because I have not yet shown all the capabilities of this indicator. Therefore, in the next article we will improve this indicator a little, because it has a small drawback here. If you want to know what the problem is, read the next article in this same series.
| File | Description |
|---|---|
| Experts\Expert Advisor.mq5 | Demonstrates interaction between Chart Trade and the Expert Advisor (Mouse Study is required for interaction). |
| Indicators\Chart Trade.mq5 | Creates a window for configuring an order before it is sent (Mouse Study is required for interaction). |
| Indicators\Market Replay.mq5 | Creates controls for interacting with the replay/simulation service (Mouse Study is required for interaction). |
| Indicators\Mouse Study.mq5 | Provides interaction between graphical controls and the user (required both for the replay/simulation system and for the real market). |
| Indicators\Order Indicator.mq5 | Responsible for displaying market orders, allowing interaction with and management of them. |
| Indicators\Position View.mq5 | Responsible for displaying market positions, allowing interaction with and management of them. |
| Services\Market Replay.mq5 | Creates and maintains the market replay/simulation service (the main file of the entire system). |
Translated from Portuguese by MetaQuotes Ltd.
Original article: https://www.mql5.com/pt/articles/13137
Warning: All rights to these materials are reserved by MetaQuotes Ltd. Copying or reprinting of these materials in whole or in part is prohibited.
This article was written by a user of the site and reflects their personal views. MetaQuotes Ltd is not responsible for the accuracy of the information presented, nor for any consequences resulting from the use of the solutions, strategies or recommendations described.

 Beyond GARCH (Part VIII): The MMAR Library And Putting it to Work in an Expert Advisor
 From Basic to Intermediate: Object Events (IV)
 OrderSend retries and circuit breaker in MQL5
 Building a Divergence System (Part II): Adaptive SuperTrend Custom Indicator

- Free trading apps
- Over 8,000 signals for copying
- Economic news for exploring financial markets
You agree to website policy and terms of use