SV Flag and Pennant pattern with alert
- Indicadores
-
Minh Truong Pham
 Hello, my name is Pham and I am a programmer and trader! At here, I create amazing forex indicators and expert advisors for Metatrader.
I will try:
+ Provide best tools base on my 5 years experience as a trader and 10 years as a programmer. - Versión: 1.0
- Activaciones: 5
Las banderas y los banderines se pueden clasificar como patrones de continuación. Por lo general, sólo representan breves pausas en un mercado dinámico. Suelen verse justo después de un movimiento grande y rápido. A continuación, el mercado suele despegar de nuevo en la misma dirección. La investigación ha demostrado que estos patrones son algunos de los patrones de continuación más fiables.
Las banderas alcistas se caracterizan por tener un máximo y un mínimo más bajos, y por estar inclinadas en contra de la tendencia. Pero a diferencia de las cuñas, sus líneas de tendencia son paralelas.
Las banderas bajistas se componen de máximos más altos y mínimos más altos. Las banderas "bajistas" también tienden a inclinarse en contra de la tendencia y sus líneas de tendencia también son paralelas.
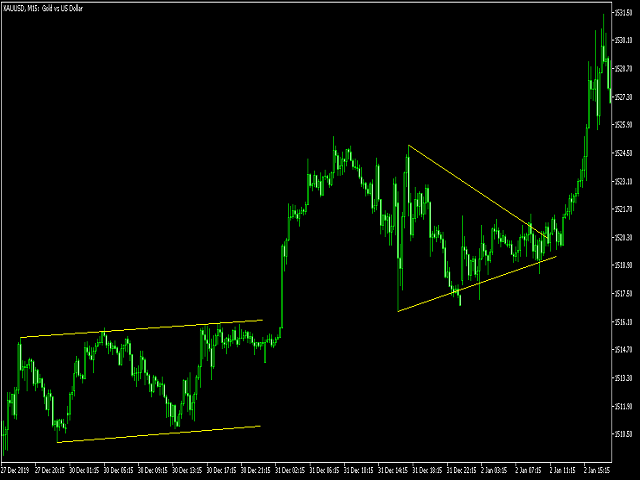
Los banderines se parecen mucho a los triángulos simétricos, pero suelen ser de menor tamaño (volatilidad) y duración.
(El volumen generalmente se contrae durante la pausa con un aumento en la ruptura).
Este indicador escanea todas las banderas y patrones de banderines y alerta cuando encuentra el patrón. Así que el operador no necesita mirar el gráfico todo el día para encontrar el patrón.
Ajustes:
+ Pendiente Horizontal: es la horizontal del patrón. Por defecto es 0.01 . Si el símbolo tiene un dígito = 2, el indicador se multiplicará automáticamente por 10. Usted debe probar para encontrar el valor más adecuado.
+ Tolerancia del punto de pivote medio: es la tolerancia de los puntos de pivote 1-3 y 3-5. En teoria, 1-3-5 puntos de pivote deben estar en una linea, pero esto es dificil en la realidad. Este valor es la tolencia del punto pivote medio (3). Si el símbolo tiene el dígito = 2, el indicador se multiplica automáticamente por 10.
+ Line extend (bar): es la extensión de la línea de tendencia. Por defecto es de 20 barras
+ Alerta: puede configurar la notificación en el terminal, aplicación móvil MT, Telegram.
Notas:
Para encontrar la mejor entrada, el operador debe esperar a romper el patrón, confirmar el precio y confirmar el volumen para asegurarse de que la tendencia continúa.