New QQE with confirm
- Indikatoren
-
Minh Truong Pham
 Hello, my name is Pham and I am a programmer and trader! At here, I create amazing forex indicators and expert advisors for Metatrader.
I will try:
+ Provide best tools base on my 5 years experience as a trader and 10 years as a programmer. - Version: 1.0
- Aktivierungen: 5
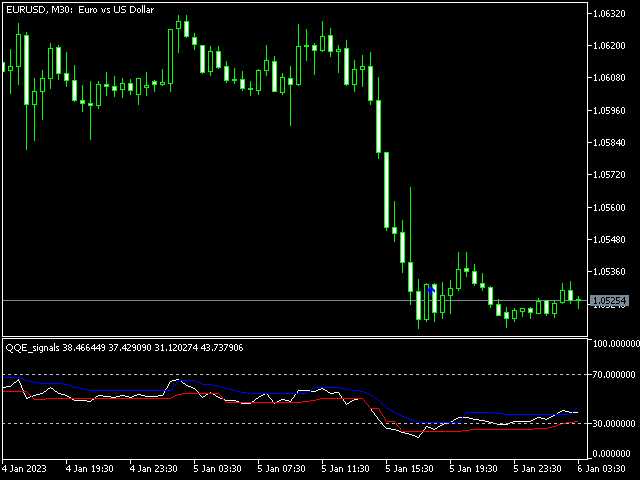
Neues QQE mit Bestätigung
Der Relative-Stärke-Index (RSI) ist ein technischer Indikator für das Momentum, der die Geschwindigkeit und Veränderung des Preises auf einer Skala von 0 bis 100 misst, typischerweise über die letzten 14 Perioden.
Da der RSI die Geschwindigkeit und die Veränderung des Preises misst, verwenden Händler diesen Indikator normalerweise auf zwei Arten:
+ Kaufen, wenn überverkauft, verkaufen, wenn überverkauft.
+ Kaufen oder verkaufen Sie, wenn Sie eine Divergenz zwischen dem RSI und dem Preis feststellen.
In zwei Möglichkeiten, es falsch, wenn rsi in overbouth (zum Beispiel) für lange Zeit oder Divergenz. Auch Preis nur nach oben gehen, wo rsi nach unten gehen.
Um dieses Problem zu lösen, studierte ich eine Menge von RSI und fand Quantitative Qualitative Estimation (QQE) Indikator. Im Wesentlichen ist der QQE ein stark geglätteter RSI. Nach vielen Tests habe ich die Berechnungsweise des QQE wie folgt geändert:
1. Basis des Standard-RSI (kann die RSI-Periode in den Indikatoreinstellungen ändern), ich berechne die EMA des Standard-RSI mit der RSI-Glättungsperiode =>( RsiMa)
2. Berechne AtrRsi= RsiMa (vorher) - RsiMa (aktuell)
3. Berechne MaAtrRsi = EMA von AtrRsi
4. Berechne dar= EMA von MaAtrRsi in Wilders_Periode = (inp_RSI_Periode * 2 - 1)
5. Berechnen Sie die untere Linie (rote Linie) und die obere Linie (blaue Linie) auf der Grundlage von dar und rsi ma und dem Kurs QQE (Standardwert ist 4.238). Diese zwei Linien definieren das Band, innerhalb dessen sich der rsi befinden sollte.
6. Alert kaufen und setzen Pfeil auf dem Chart, wenn Kerze vor haben rsi in überverkauft; rsi<lower_line UND Kerze aktuelle haben rsi>lowerline. (entgegengesetzt zum Fall des Verkaufs)
Dieser Indikator zeigt nur die Kauf- oder Verkaufsrichtung an. Um eine Entscheidung zu treffen, ist es notwendig, andere Indikatoren wie Trendindikatoren zu kombinieren...