Strategy Tester Macd Bulls Bears
- Indikatoren
- Version: 1.0
- Aktivierungen: 10

Das Produkt Strategy Tester ist ein Indikator, mit dem Sie Strategien testen und ausführen können.
In diesem Indikator sind insgesamt 64 Strategien enthalten. Er verwendet 3 Indikatoren.
Sie können Zehntausende von Strategien testen, indem Sie die Parametereinstellungen dieser Indikatoren ändern.
Sie können 6 Strategien gleichzeitig ausführen. Mit diesem Produkt können Sie jetzt Ihre eigenen Signale erstellen.
Empfehlungen und Eigenschaften
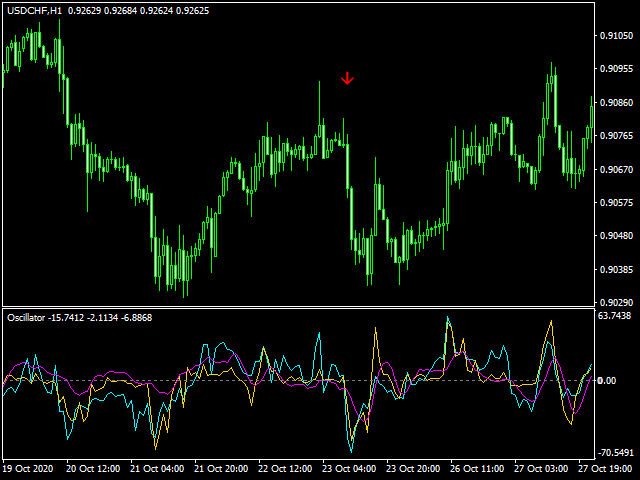
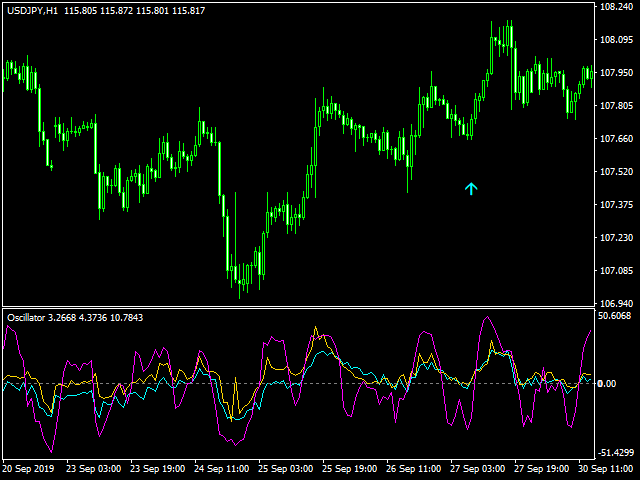
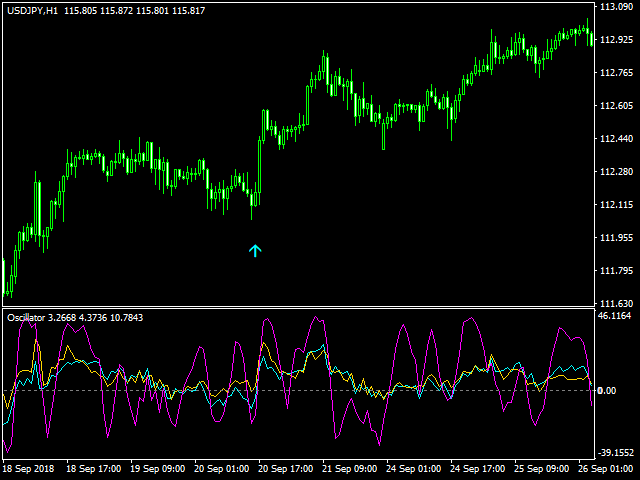
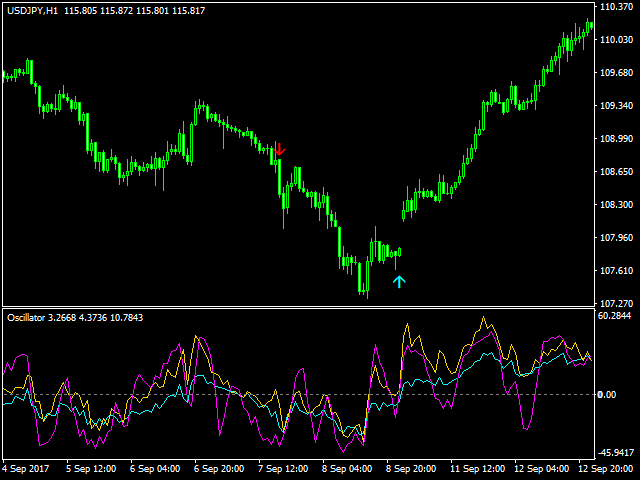
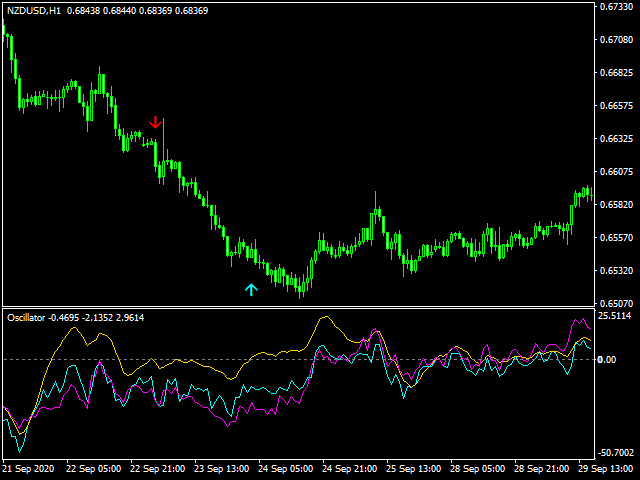
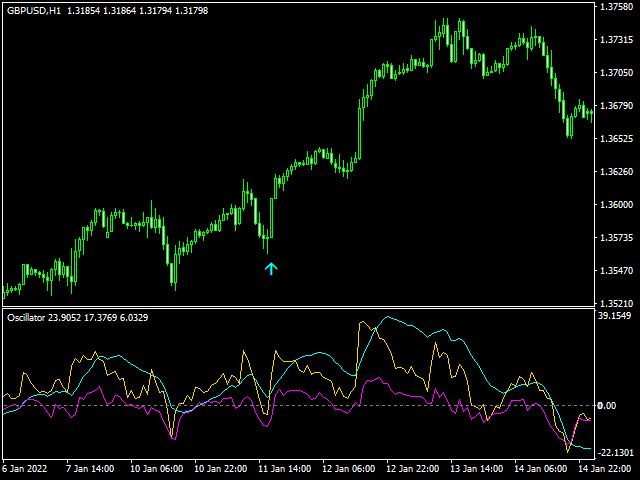
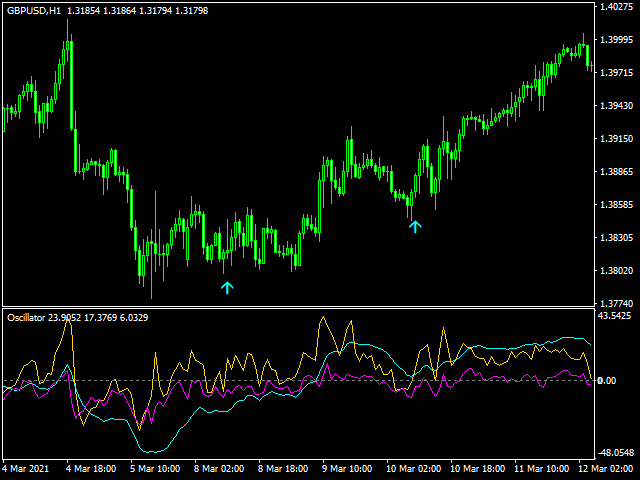
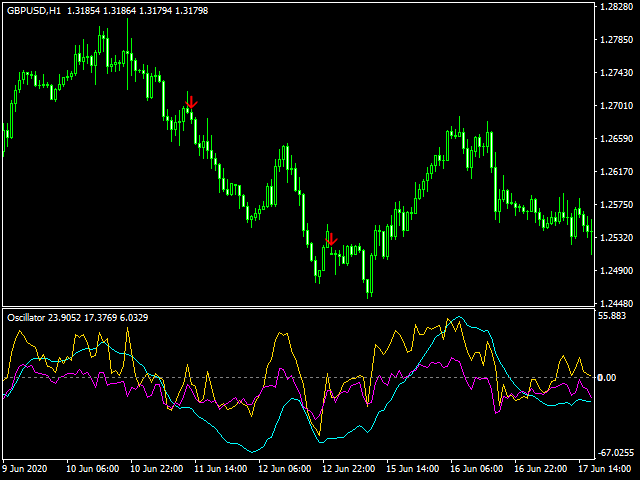
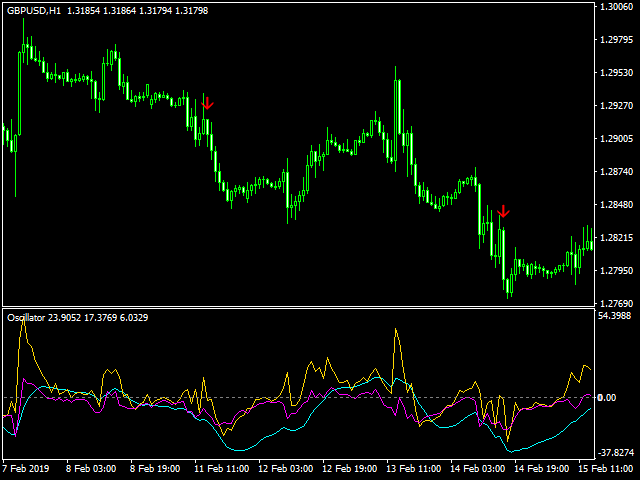
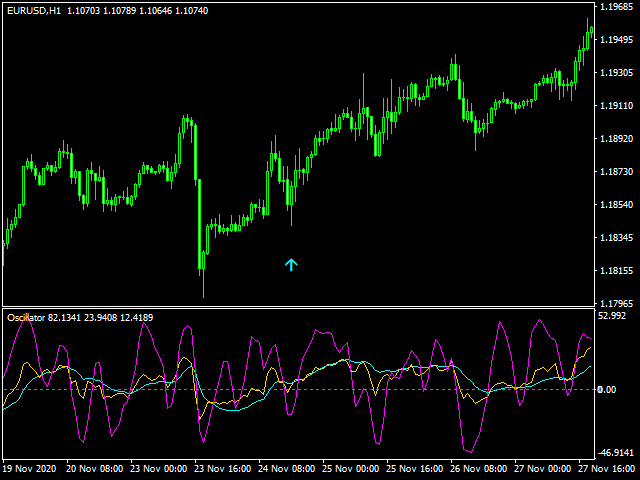
- Verwendete Indikatoren:Macd, Bulls power, Bears power
- Es funktioniert auf allenZeitrahmen
- Empfohlener Zeitrahmen: H1
- Sie können in allen Paaren testen.
- Es gibt insgesamt 64 Strategien.
- Sie können Zehntausende von Strategien testen, indem Sie die Parametereinstellungen der Indikatoren ändern.
- Testen Sie die Strategien eine nach der anderen in der Sektion "Test Strategies".
- Es können 6 Strategien mit denselben Parametern ausgeführt werden. Schließen Sie den Abschnitt "Teststrategien" ein.
- Für Strategien mit unterschiedlichen Parametern sollten Sie einen neuen Grafikbildschirm öffnen.
- Dank der Alarmfunktionen können Sie das Signal sofort erhalten.
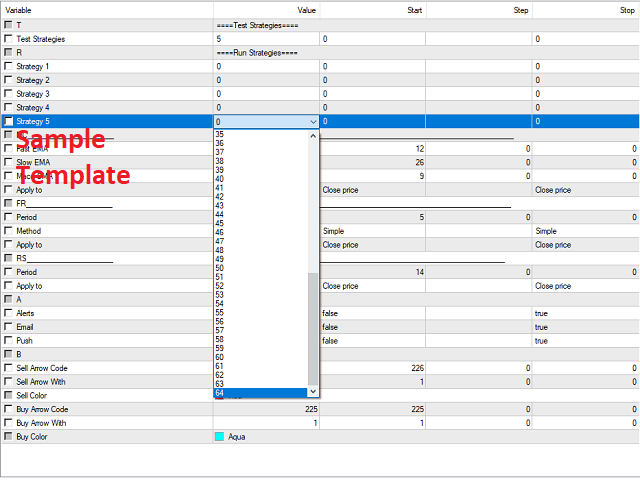
Parameter
- ====Test-Strategien====
- Test Strategies= Testen Sie hier die Strategien nacheinander
- ====Strategien ausführen====
- Strategie 1=
- Strategie 2=
- Strategie 3=
- Strategie 4=
- Strategie 5= Wählen Sie in diesen Abschnitten die Strategien aus , die Sie ausführen möchten.
- = Dieser Abschnitt enthält die Parametereinstellungen von 3 Indikatoren =
- =Indikator 1=
- =Indikator 2=
- =Indikator 3=
- ====Alarmeinstellungen====
- Alerts= Standard mt4 Alarm Einstellung.
- E-Mail= Einstellung für E-Mail-Warnungen
- Push= Einstellung für mobile App-Warnungen
- ====Pfeile Einstellung====
- Verkaufspfeil Code= Verkaufspfeil Stil Einstellung
- Sell Arrow With= Einstellung für die Breite des Verkaufspfeils
- Farbe verkaufen= Pfeilfarbe verkaufen
- Buy Arrow Code= Pfeilstil-Einstellung kaufen
- Buy Arrow With= Pfeilbreiteneinstellung kaufen .
- Buy Color= Pfeilfarbeinstellung kaufen