EMA Trend
- Indikatoren
- Version: 1.0
- Aktivierungen: 20

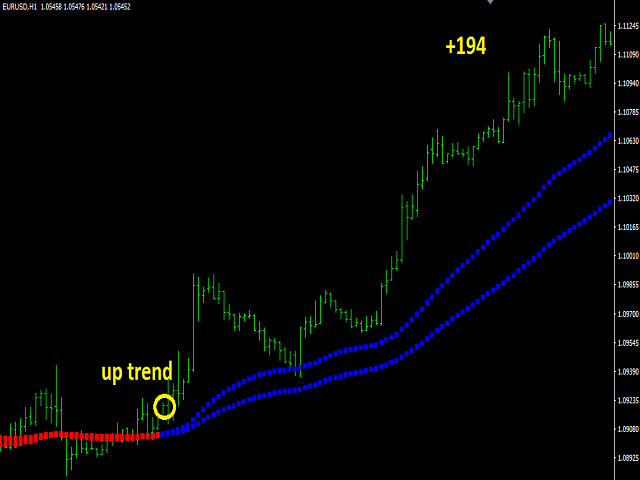
Der EMA-Trend-Indikator ist ein Trendindikator mit zwei gleitenden Durchschnitten. Diese beiden gleitenden Durchschnitte sind der Haupttrendindikator mit 89 EMA. Der 89 EMA wird allgemein als Trend auf dem Devisenmarkt angesehen. Der zweite gleitende Durchschnitt ist 49 EMA. Es wurde ein Trend mit zwei gleitenden Durchschnitten erstellt.
Sie können diese Anzeige allein als Trendindikator verwenden. Oder mit anderen für Ihre Strategie geeigneten Indikatoren. Dieser Indikator sendet eine Warnung, sobald ein neuer Trend beginnt.
Funktionen
- Sie können die Perioden auswählen und bearbeiten.
- Zeitrahmen, Ma-Modus, Preis-Modus.
- Sie können neue Trendwarnungen mit Alarmfunktionen erhalten.
- Sendet die Warnung an den mt4-Bildschirm
- Sendet Alarme an die mobile App
- Mail-Adresse.
Parameter
- Periode_1 - Periode 1 Level-Einstellung
- Period1_timeframes - Einstellung des Zeitrahmens für Periode 1
- Period1_mode - Einstellung des Period1-Modus
- Period1_pricemode - Einstellung des Preismodus
- Periode_2 - Einstellung des Levels für Periode 2
- Period2_timeframes - Einstellung des Zeitrahmens für Periode 2
- Period2_mode - Einstellung des Period2-Modus
- Period2_pricemode - Preismodus-Einstellungen
- AlertsOn - Alarme senden. Wenn diese Funktion aktiviert ist, wird sie auch in anderen Warnungseigenschaften aktiviert.
- AlertsMessage - eine Nachricht senden
- AlertsSound - Einstellung für akustische Warnungen
- AlertsEmail - Einstellung für E-Mail-Warnungen. Sendet Warnungen an eine E-Mail Adresse.
- SoundFile - Warnton