Face Smiling Trend
- Indikatoren
- Version: 1.1
- Aktualisiert: 5 Januar 2023
- Aktivierungen: 20

Der Trendindikator Face Smiling ist ein Oszillator, der für die Suche nach Wendepunkten entwickelt wurde. Der Trendindikator Face Smiling ist ein Oszillator, der in seiner Arbeit einen Durchschnittspreis für einen bestimmten Zeitraum verwendet und dazu bestimmt ist, die Umkehrpunkte des Preises zu bestimmen.
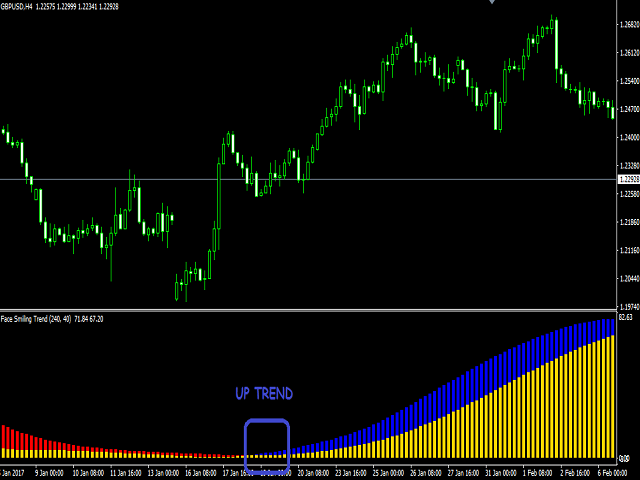
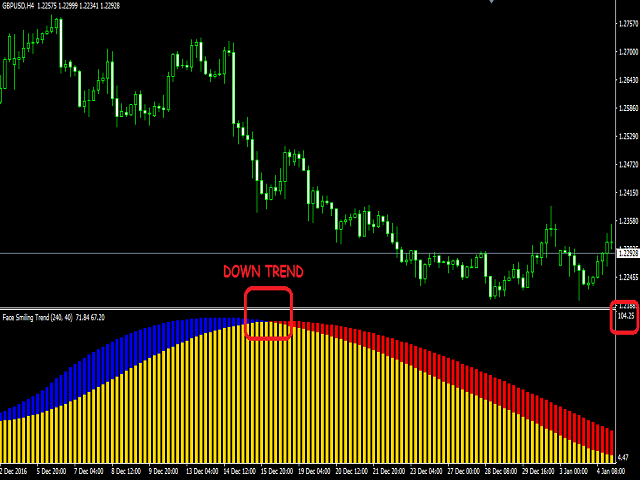
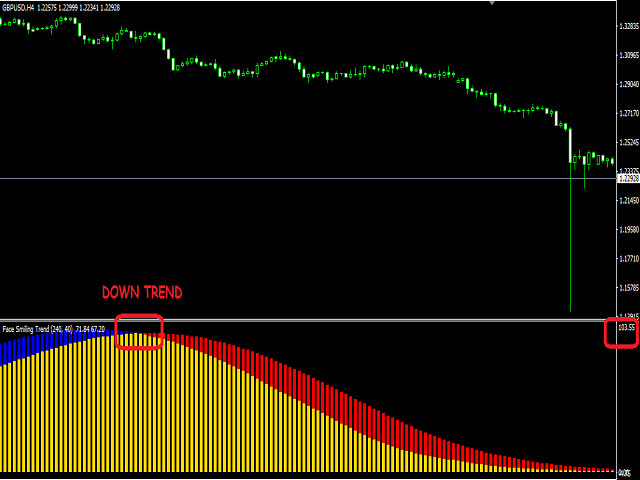
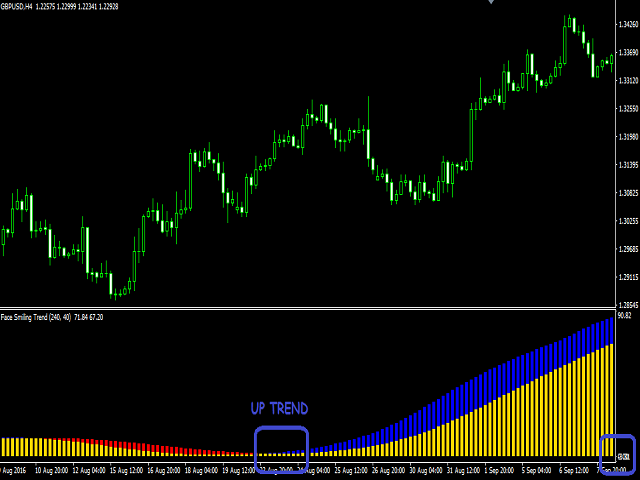
Der Face Smiling Trend-Indikator oszilliert zwischen 0,00 (überverkauft) und 105 (überkauft), je nach Marktbedingungen. Rote Balken deuten auf Abwärtsdruck und blaue Balken auf Aufwärtsdruck hin.
In der Regel tritt eine Trendumkehr ein, wenn der Indikator die Höchstwerte 0 und 100 erreicht. Zu solchen Zeiten ist die Wahrscheinlichkeit einer Bewegung in die umgekehrte Richtung sehr hoch.
Handelssignale
- Aufwärtstrends - Warten Sie auf den ersten blauen Balken in der Nähe der 0,00-Marke (überverkauft).
- Abwärtstrends - Warten Sie auf den ersten roten Balken, der in der Nähe der 105er-Marke erscheint (überkauft).
Bevorzugte Indikatoren
- Währungspaare - beliebig
- Bevorzugte Zeitrahmen - 1 Minute und höher
- Sitzungen - Beliebig
Parameter
- Zeitraum - die Anzahl der Balken für die Berechnung des Indikators
- Durchschnitt - Mittelwertbildung des Preises eines Finanzinstruments.