Strategy Tester Macd Bulls Bears
- 지표
- 버전: 1.0
- 활성화: 10

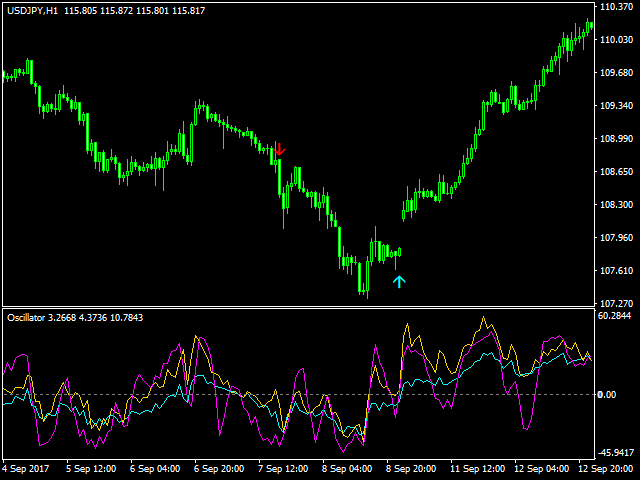
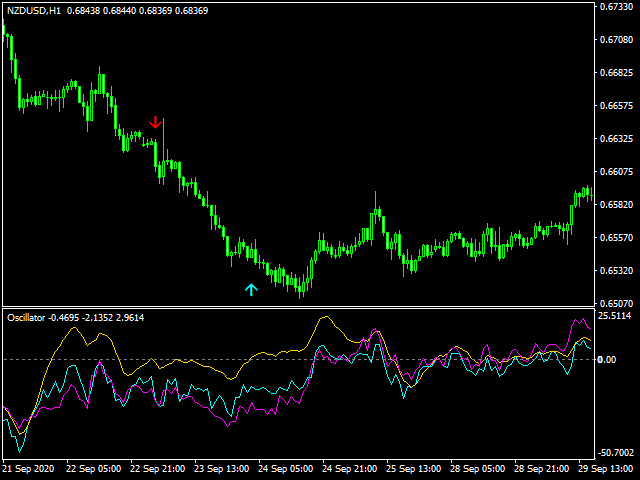
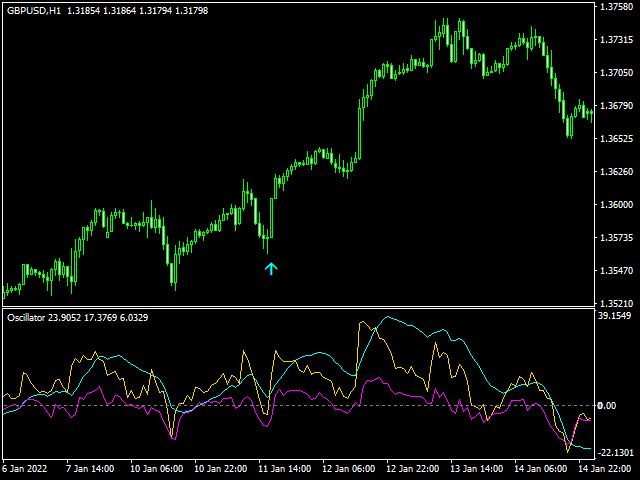
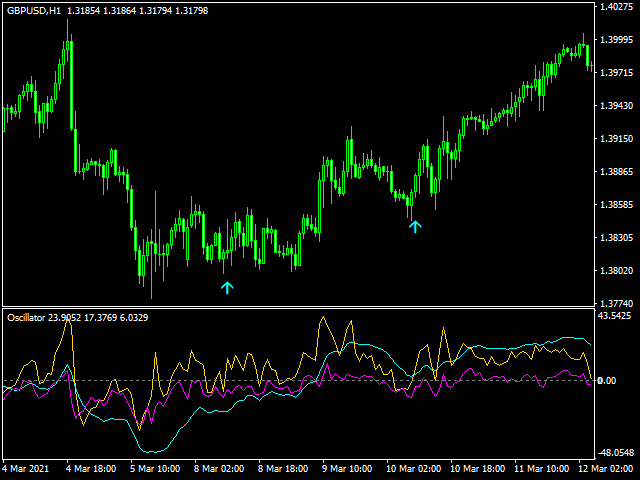
The Strategy Tester product is an indicator where you can both test and run strategies.
There are 64 strategies in total in this indicator. It uses 3 indicators.
You can test tens of thousands of strategies by changing the parameter settings of these indicators.
You can run 6 strategies at the same time. With this product, you will now create your own signals.
Recommendations and Features
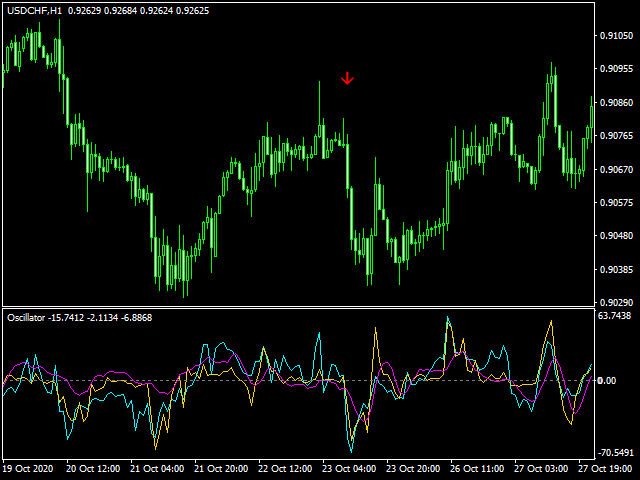
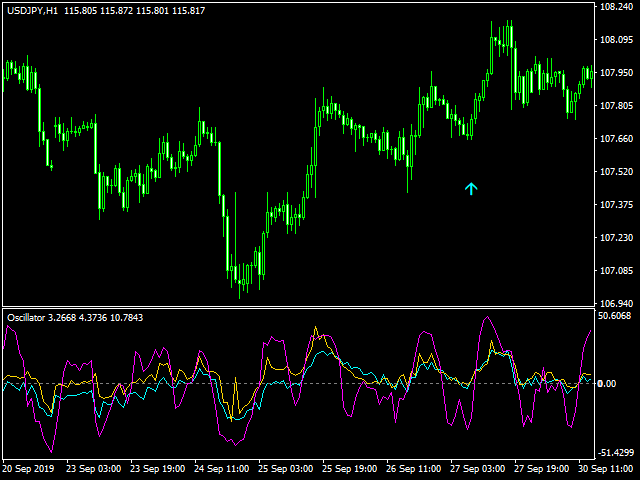
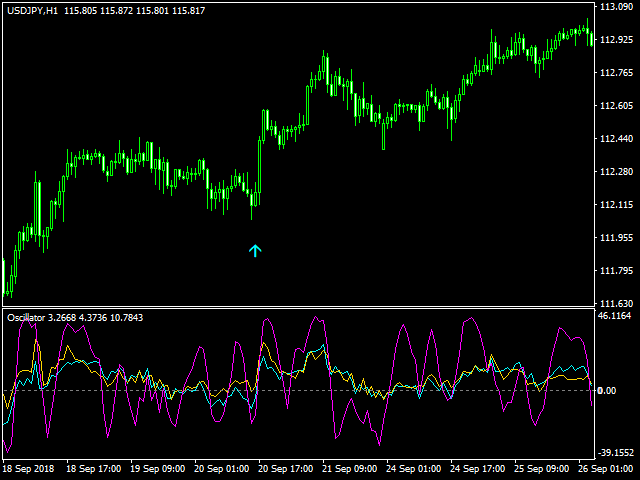
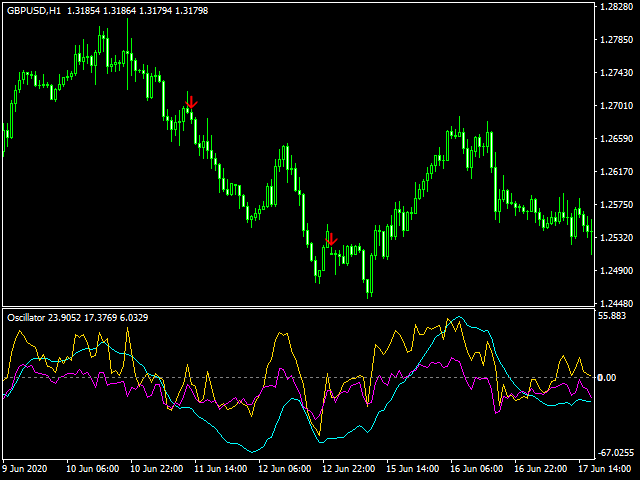
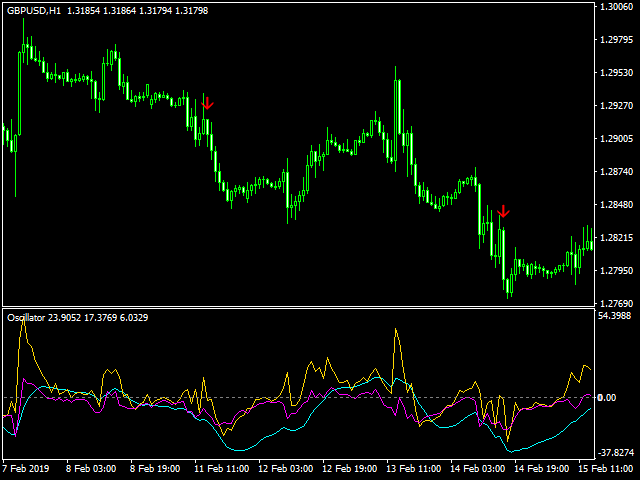
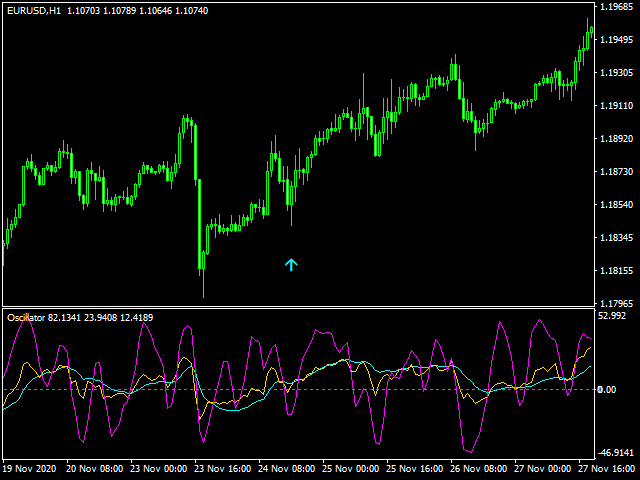
- Used indicators: Macd, Bulls power, Bears power
- It works on all time frame
- Recommended time frame H1
- You can test in all pairs.
- There are 64 strategies in total.
- You can test tens of thousands of strategies by changing the parameter settings of the indicators.
- Test the strategies one by one in the "Test Strategies" section.
- It can run 6 strategies of the same parameters. Including the Test Strategies section.
- You should open a new graphic screen for strategies with different parameters.
- Thanks to the alert features, you can receive the signal instantly.
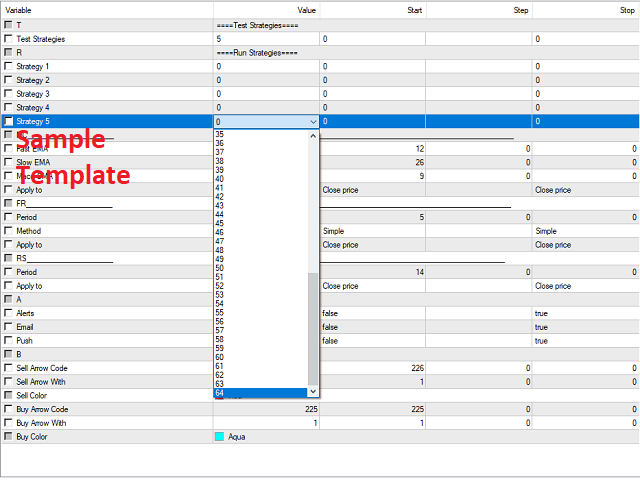
Parameters
- ====Test Strategies====
- Test Strategies= Test the strategies one by one here
- ====Run Strategies====
- Strategy 1=
- Strategy 2=
- Strategy 3=
- Strategy 4=
- Strategy 5= Select the strategies you want to run in these sections.
- = This section contains parameter settings of 3 indicators =
- =Indicator 1=
- =Indicator 2=
- =Indicator 3=
- ====Alert Setting====
- Alerts= Standard mt4 alert setting.
- Email= Email alert setting
- Push= Mobile app alert setting
- ====Arrows Setting====
- Sell Arrow Code= Sell arrow style setting
- Sell Arrow With= Sell arrow width setting
- Sell Color= Sell arrow color setting
- Buy Arrow Code= Buy arrow style setting
- Buy Arrow With= Buy arrow width setting.
- Buy Color= Buy arrow color setting